FIGURE

Figure 2

ID
ZDB-FIG-240613-43
Publication
D'Gama et al., 2024 - Ciliogenesis defects after neurulation impact brain development and neuronal activity in larval zebrafish
Other Figures
All Figure Page
Back to All Figure Page
Figure 2

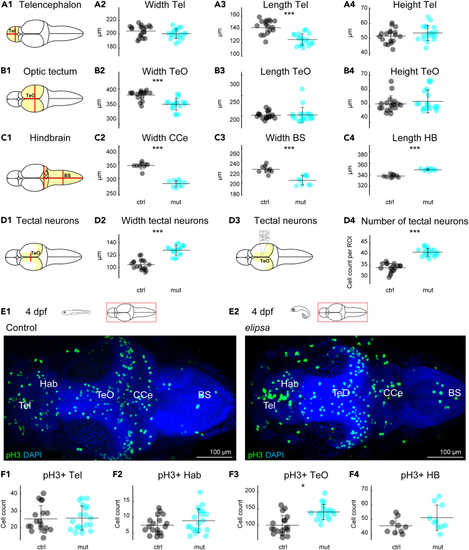
Cilia defects lead to abnormal brain size and alters cell proliferation in the optic tectum

(A1–D4) Quantification of brain morphology of 4 dpf larval brains for control (black) and elipsa mutants (cyan). Schematic representation of the measurements for (A1) telencephalon, (B1) optic tectum, (C1) hindbrain regions and (D1) tectal neurons. Brain size was estimated by measuring the width, length, and height of telencephalon (A2, A3, A4), optic tectum (B2, B3, B4), width of CCe (C2), width of BS (C3), length of hindbrain (C4), and the width (D2) and number of neurons in a defined region of interest (D3) (ROI of 36 × 28μm) (D4) of tectal neurons. Controls are in black and elipsa mutants in cyan. n = 18 controls and 19 mutants for A2, A3, A4, B2, B3, B4, D2, D4. n = 9 controls and 10 mutants for C2, C3 and C4.

(E1 and E2) staining for mitotic cells using an anti-pH3 antibody.

(F1–F4) Cell count for pH3 positive cells (pH3+) in telencephalon (F1), habenula (F2), optic tectum (F3) and hindbrain (F4). ∗: p < 0.05, ∗∗∗: p < 0.001 according to Wilcoxon Rank-Sum test. Mean ± SD (standard deviation) is indicated on scatterplots. Tel, Telencephalon; Teo, Optic Tectum; BS, Brain stem; CCe, Corpus Cerebelli; HB, Hindbrain.

Expression Data

Expression Detail
Antibody Labeling
Phenotype Data

Phenotype Detail
Acknowledgments
This image is the copyrighted work of the attributed author or publisher, and ZFIN has permission only to display this image to its users. Additional permissions should be obtained from the applicable author or publisher of the image. Full text @ iScience