FIGURE SUMMARY
Title

Dynamics of collagen oxidation and cross linking in regenerating and irreversibly infarcted myocardium

Authors
Akam-Baxter, E.A., Bergemann, D., Ridley, S.J., To, S., Andrea, B., Moon, B., Ma, H., Zhou, Y., Aguirre, A., Caravan, P., Gonzalez-Rosa, J.M., Sosnovik, D.E.
Source
Full text @ Nat. Commun.

Reactivity of a library of aldehyde-binding fluorescent probes.

a Chemical structure of the synthesized TAMRA-based probes. b Aldehyde-ligation reaction types and corresponding reaction rate constants relative to the commercially available TMR-HZD. The rate constant of the oxyamine probe (TMR-O) is 27-fold higher than TMR-HZD. ch Reaction rates of the probes with butyraldehyde were followed by HPLC with fluorescence detection. HPLC traces for the forward (c, e, g) and reverse (d, f, h) reactions for TMR-HZD, TMR-HZN and TMR-O with butyraldehyde showing the ligation product (orange) and the free, unbound probe (blue). Of note, the HPLC traces for the commercially available TMR-HZD (c, d) also contain a small unidentified impurity (black). i Plots of the observed rate constant for the formation of the aldehyde-ligation products, (j) the corresponding percent conversion as a function of time and, (k) the percent product generated at 100 min. The non-binding control probe (TMR-NB), in which a cyclic piperazine group replaces the reactive hydrazine, shows no reactivity, confirming the specificity of the oxyamine (TMR-O), hydrazine (TMR-HZN) and pyrrole (TMR-Pyr) based TAMRA probes for aldehydes. TMR-O, however, has the fastest reactivity and highest percent conversion to ligation product. Values are plotted as the average of three experiments ± standard deviation. Source data are provided in the Source Data file.

TMR-O shows superior selective binding to protein and tissue aldehydes.

Created in part with Biorender.com. a Binding of the probes to aldehyde-rich protein (BSA-Ald) was determined by incubating the probes (10 mM) with BSA-Ald (25 mM protein, 100 mM aldehyde) with and without aldehyde-blocking with methoxylamine. After incubation at 37 °C for 3 h, free and protein-bound probe were separated by passing solutions through a 10 kD molecular weight cut-off (MWCO) filter. b UV-Vis spectra of a solution of TMR-O incubated with BSA-Ald before (blue) and after (red) passing through a MWCO filter show a significant decrease in the TMR-O signal due to binding to BSA-Ald. (c) Blocking of the aldehyde-reactive sites on BSA-Ald obstructs TMR-O binding, resulting in little change in the UV-Vis absorption of TMR-O after filtration. d, e Quantification of the percent binding of aldehyde-reactive TAMRA-based probes to BSA-Ald without (d) and with (e) methoxamine pre-blocking demonstrates their specificity for aldehydes. f Lysine aldehydes (LysAld) are abundant in healthy mammalian aorta and zebrafish bulbus due to elastin turn-over and cross-linking (top). These tissues, therefore, provide a robust control to characterize the accuracy of TAMRA-based aldehyde-reactive probes for lysine aldehydes such as allysine and hydroxy-allysine. g, h White light and fluorescence reflectance images of whole mouse (g) and zebrafish (h) hearts excised after systemic injection of TMR-O or TMR-NB. TMR-O binds specifically to the aorta and bulbus, while the non-binding control probe TMR-NB produces no signal. Imaging was performed in 3 mice/fish per group with consistent results. i Quantification of fluorescence signal intensity in the zebrafish bulbus 4 h after IP injection of an allysine-binding probe (2 nmol/g) shows > 2-fold higher signal for TMR-O compared to other probes and no uptake of TMR-NB. Signal is normalized to the fluorescence signal of a phantom made from the injected dose of each probe. Data are means ± SD of three independent experiments. Source data are provided in the Source Data file.

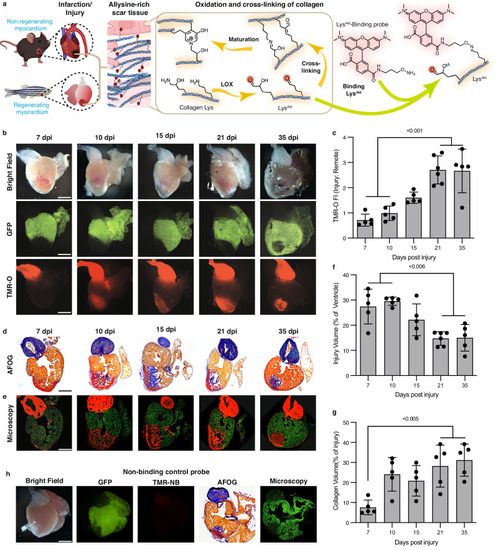
Collagen oxidation and cross-linking in the injured zebrafish heart.

Created in part with Biorender.com. a In the early stages of healing, a similar process occurs in injured zebrafish and murine hearts: Lysyl-oxidase- (LOX)-mediated oxidation of collagen in the wound converts lysine/hydroxylysine residues to highly reactive aldehydes (allysine/hydroxyallysine, LysAld), which form cross-links. TMR-O binds to LysAld, providing a readout of the initial steps in collagen cross-linking. b Natural history of collagen oxidation and cross-linking in a zebrafish cryoinjury model (n = 5 except for 21 dpi, n = 6). Adult zebrafish, with cardiomyocyte-specific expression of GFP, were injected with TMR-O (2 nmol/g, IP) and the hearts were excised and imaged 4 h after injection. The absence of GFP delineates the area of injury, which shows a steady increase in TMR-O signal from 10–21 days post-injury (dpi). c TMR-O fluorescence intensity peaked between 21–35 dpi (n = 5 except for 21 dpi, n = 6). d AFOG-stained histology sections show the collagen/elastin rich bulbus and collagen-rich healing injury at 10–35 dpi (n = 5 except for 21 dpi, n = 6). e Fluorescence microscopy of adjacent sections shows that the TMR-O signal is localized to the collagen-rich areas of the injured heart (n = 5 except for 21 dpi, n = 6). f The total area of injured myocardium, quantified by histology, decreased steadily between 10–35 dpi, consistent with the regenerative capacity of the zebrafish heart (n = 5 except for 21 dpi, n = 6). (g) Collagen content within the area of injury peaked 21–35 dpi (n = 5 except for 21 dpi, n = 6). h The hearts of injured zebrafish injected with the non-binding probe TMR-NB (2 nmol/g, IP) at 15 dpi showed no fluorescence signal in the heart or bulbus (n = 3). Data are means ± SD of five-six measurements, where each data point represents one zebrafish. P-values are shown where significant, one-way ANOVA with post hoc comparisons, two tailed. Scale bar = 300 μm. Source data are provided in the Source Data file.

Collagen oxidation and cross-linking in the infarcted mouse heart.

a The hearts of adult mice injected with TMR-O (2 nmol/g, IV) at 5–35 days after myocardial infarction (MI) are shown in their long axis. TMR-O fluorescence in the infarct is, qualitatively, already high at day 10, (n = 5 except for 35 dpi where n = 6). b Sectioning of the heart into 1 mm thick short axis slices confirms that the TMR-O signal is arising from the infarcted myocardium and is patchy but substantial by day 10 (n = 5 except for 35 dpi where n = 6). c Time course of TMR-O fluorescence in murine infarcts(n = 5 except for 35 dpi where n = 6). The oxidation and cross linking of collagen is already significant by day 10, peaks at day 21 and subsequently decreases. Data are means ± SD of 5-6 measurements where each data point represents one mouse. Source data are provided in the Source Data file. P-values are shown where significant, one-way ANOVA with post hoc comparisons, two tailed. d, e AFOG-stained histology sections at the mid-ventricular level show that the collagen-rich injury area (blue) colocalizes well with the TMR-O signal on fluorescence microscopy (n = 5 except for 35 dpi where n = 6). Healthy myocardium is stained with a green, fluorescent nuclear stain (NucSpot). Scale bars = 1 mm.

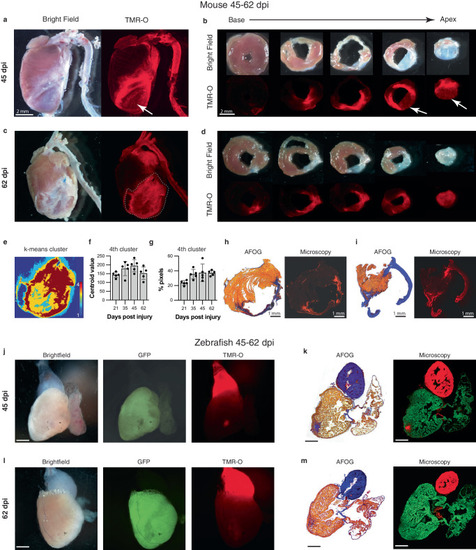
Dynamic deposition and oxidation of new collagen in chronic infarcts.

a, b Whole-heart and short axis section of a mouse heart 45 dpi. Some areas of the remodeled scar are structurally static with little TMR-O uptake (arrows, n = 5). However, other areas of the scar show substantial amounts of TMR-O uptake, consistent with the oxidation of newly deposited collagen. c, d Similarly, at day 62 some areas of the scar show high amounts of probe uptake, consistent with dynamic collagen deposition (n = 5). eg K-means clustering (4 clusters) of the infarct zone in the whole-heart TMR-O images. e TMR-O clusters in a day 62 infarct zone, demarcated by the dashed lines in panel C. The cluster of highest TMR-O signal (4th cluster, brown) occupies a substantial portion of the infarct. f, g The centroid value and area of the 4th cluster did not change significantly over time (n = 5, values are plotted as the average ± the standard deviation) one-way ANOVA, with Tukey’s multiple comparisons, consistent with active/new collagen deposition in the infarcts at all stages of healing. Source data are provided in the Source Data file. h, i AFOG staining, and fluorescence microscopy confirmed the heterogeneity of TMR-O uptake in the day 45 and 62 murine infarcts (n = 5). j, k In injured zebrafish hearts (n = 5, scale bar = 300 μm.) most of the myocardium had been regenerated by 45 dpi and the size of the residual injury was small. However, within these small residual areas of injury substantial levels of TMR-O uptake were still seen. l, m Within 2 months of injury no evidence of myocardial injury or TMR-O uptake was seen in the zebrafish hearts (n = 5, scale bar = 300 μm.), consistent with complete resorption of the scars and successful regeneration of the myocardium. Scale bars in (gj) are 300 µm.

Lysine aldehyde cross-links mature into degradation-resistant final products in infarcted mouse hearts but not in zebrafish hearts.

Created in part with Biorender.com. a Enzymatic oxidation of telopeptide [hydroxy]lysine residues of collagen by Lysyl oxidase (LOX) to form [hydroxy]allysine aldehydes is a prerequisite of collagen cross-linking and fibril formation. b Subsequent self-assembly of collagen molecules is spontaneous and is stabilized by intramolecular reactions of [hydroxy]allysine groups with one another or with helical [hydroxy]lysine residues. c Initial allysine cross-links further rearrange and react with additional [hydroxy]allysine or [hydroxy]lysine groups to form stable pyridinium-containing cross-links. d Chemical structures of pyridinoline (Pyd) and deoxypyridinoline (DPD), the mature degradation-resistant products of collagen cross-linking. e HPLC traces of a solution of DPD (100 nM, top, black) and Pyd (100 nM, bottom, red) juxtaposed with traces of solutions of hydrolyzed mouse or zebrafish hearts excised 21 days after injury. All zebrafish and mouse heart hydrosylates were prepared to contain similar amounts of hydroxyproline (3–8 µg/mL). f Quantification of Pyd in infarcted mouse and zebrafish hearts 21 days post injury (dpi) shows no detectable Pyd levels in zebrafish hearts despite substantial hydroxyproline content in the analyzed tissue (n = 3, t-test). Similarly, DPD could not be detected in the HPLC traces of the zebrafish hearts. g In infarcted mouse hearts, Pyd levels increase with infarct age consistent with scar maturation (n = 3 except for 5 dpi where n = 5, one-way ANOVA with Tukey’s post hoc comparison). h Levels of DPD in infarcted mouse hearts peak earlier after infarction and are lower than Pyd (n = 3 except for 5 dpi where n = 5, one-way ANOVA with Tukey’s post hoc comparison, note the scale difference between panels g and h). Data are means ± SD of 3–5 independent measurements where each data point represents one animal. T-test One-way ANOVA with Tukey’s post hoc comparison Source data are provided in the Source Data file.

Hydroxylation of lysine in newly deposited collagen differs markedly in infarcted murine and zebrafish hearts.

HPLC traces of the amino acids in infarcted zebrafish (a, b) and mouse (c, d) hearts at 1 and 3 weeks after injury. The expanded regions in the insets are for the hydroxyproline (Hyp) and hydroxylysine (OHK) peaks, at 9.3 min and 26.7 min respectively, and the Aspartic acid (Asp) peak at 11.3 min to which the chromatogram is normalized. Aspartic acid (Asp) was quantified and used to normalize Hyp and OHK values to account for total tissue content in each sample. The Asp peak is denoted with a red asterisks (*) in the full HPLC chromatograms. Quantification of Hyp:Asp and OHK:ASP in mouse (e, n = 5 for W1, n = 4 for W3) and zebrafish (f, n = 4) hearts at 1 and 3 weeks after injury. Hyp:Asp increases significantly in both zebrafish and mice, while OHK:Asp increases significantly in mice but not zebrafish. g Comparison of the percent change of Hyp and OHK from week 1 to week 3 after injury in mice and zebrafish hearts. Despite a marked increased in Hyp from weeks 1–3, indicative of new collagen deposition, little change in OHK is seen in the zebrafish hearts. Statistical comparison by unpaired t-test, n = 4–5 per sample values are plotted as the average ± the standard deviation. Source data are provided in the Source Data file.

Acknowledgments
This image is the copyrighted work of the attributed author or publisher, and ZFIN has permission only to display this image to its users. Additional permissions should be obtained from the applicable author or publisher of the image. Full text @ Nat. Commun.