IMAGE

Fig. 6

ID
ZDB-IMAGE-240612-25
Source
Figures for Akam-Baxter et al., 2024
Image
Figure Caption

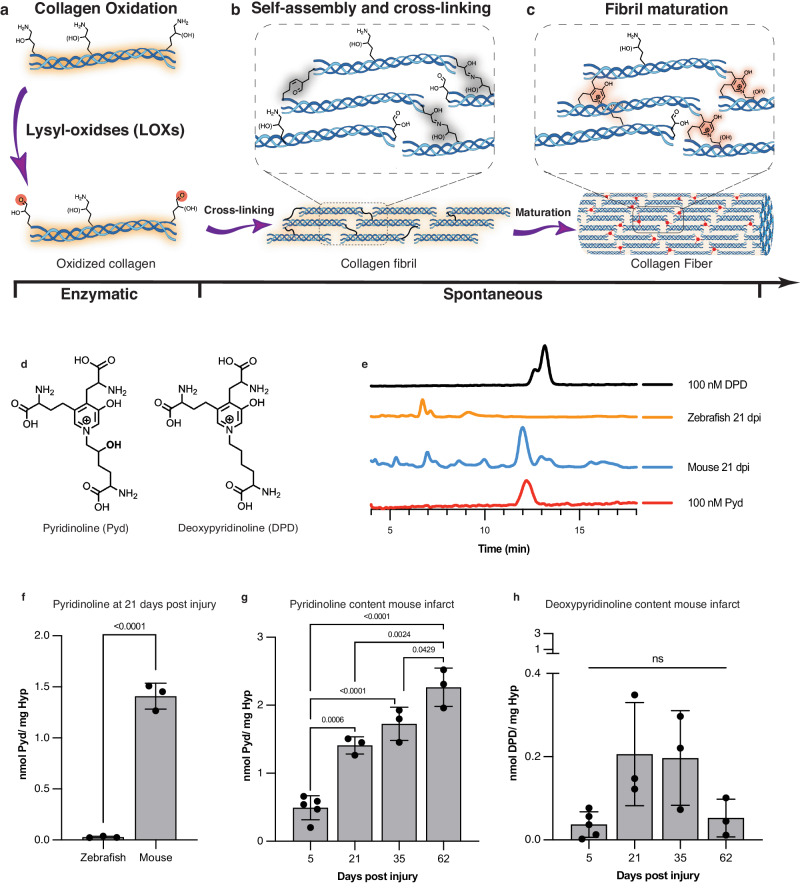
Fig. 6 Lysine aldehyde cross-links mature into degradation-resistant final products in infarcted mouse hearts but not in zebrafish hearts.

Created in part with Biorender.com. a Enzymatic oxidation of telopeptide [hydroxy]lysine residues of collagen by Lysyl oxidase (LOX) to form [hydroxy]allysine aldehydes is a prerequisite of collagen cross-linking and fibril formation. b Subsequent self-assembly of collagen molecules is spontaneous and is stabilized by intramolecular reactions of [hydroxy]allysine groups with one another or with helical [hydroxy]lysine residues. c Initial allysine cross-links further rearrange and react with additional [hydroxy]allysine or [hydroxy]lysine groups to form stable pyridinium-containing cross-links. d Chemical structures of pyridinoline (Pyd) and deoxypyridinoline (DPD), the mature degradation-resistant products of collagen cross-linking. e HPLC traces of a solution of DPD (100 nM, top, black) and Pyd (100 nM, bottom, red) juxtaposed with traces of solutions of hydrolyzed mouse or zebrafish hearts excised 21 days after injury. All zebrafish and mouse heart hydrosylates were prepared to contain similar amounts of hydroxyproline (3–8 µg/mL). f Quantification of Pyd in infarcted mouse and zebrafish hearts 21 days post injury (dpi) shows no detectable Pyd levels in zebrafish hearts despite substantial hydroxyproline content in the analyzed tissue (n = 3, t-test). Similarly, DPD could not be detected in the HPLC traces of the zebrafish hearts. g In infarcted mouse hearts, Pyd levels increase with infarct age consistent with scar maturation (n = 3 except for 5 dpi where n = 5, one-way ANOVA with Tukey’s post hoc comparison). h Levels of DPD in infarcted mouse hearts peak earlier after infarction and are lower than Pyd (n = 3 except for 5 dpi where n = 5, one-way ANOVA with Tukey’s post hoc comparison, note the scale difference between panels g and h). Data are means ± SD of 3–5 independent measurements where each data point represents one animal. T-test One-way ANOVA with Tukey’s post hoc comparison Source data are provided in the Source Data file.

Acknowledgments
This image is the copyrighted work of the attributed author or publisher, and ZFIN has permission only to display this image to its users. Additional permissions should be obtained from the applicable author or publisher of the image. Full text @ Nat. Commun.