|
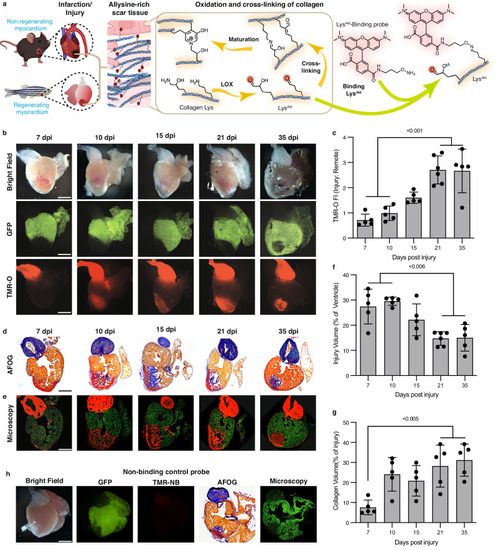
Collagen oxidation and cross-linking in the injured zebrafish heart. Created in part with Biorender.com. a In the early stages of healing, a similar process occurs in injured zebrafish and murine hearts: Lysyl-oxidase- (LOX)-mediated oxidation of collagen in the wound converts lysine/hydroxylysine residues to highly reactive aldehydes (allysine/hydroxyallysine, LysAld), which form cross-links. TMR-O binds to LysAld, providing a readout of the initial steps in collagen cross-linking. b Natural history of collagen oxidation and cross-linking in a zebrafish cryoinjury model (n = 5 except for 21 dpi, n = 6). Adult zebrafish, with cardiomyocyte-specific expression of GFP, were injected with TMR-O (2 nmol/g, IP) and the hearts were excised and imaged 4 h after injection. The absence of GFP delineates the area of injury, which shows a steady increase in TMR-O signal from 10–21 days post-injury (dpi). c TMR-O fluorescence intensity peaked between 21–35 dpi (n = 5 except for 21 dpi, n = 6). d AFOG-stained histology sections show the collagen/elastin rich bulbus and collagen-rich healing injury at 10–35 dpi (n = 5 except for 21 dpi, n = 6). e Fluorescence microscopy of adjacent sections shows that the TMR-O signal is localized to the collagen-rich areas of the injured heart (n = 5 except for 21 dpi, n = 6). f The total area of injured myocardium, quantified by histology, decreased steadily between 10–35 dpi, consistent with the regenerative capacity of the zebrafish heart (n = 5 except for 21 dpi, n = 6). (g) Collagen content within the area of injury peaked 21–35 dpi (n = 5 except for 21 dpi, n = 6). h The hearts of injured zebrafish injected with the non-binding probe TMR-NB (2 nmol/g, IP) at 15 dpi showed no fluorescence signal in the heart or bulbus (n = 3). Data are means ± SD of five-six measurements, where each data point represents one zebrafish. P-values are shown where significant, one-way ANOVA with post hoc comparisons, two tailed. Scale bar = 300 μm. Source data are provided in the Source Data file.
|