
- Title
-
Nkx1.2 deletion decreases fat production in zebrafish
- Authors
- Wang, X., Li, X., Wang, Y., Ren, Z., Du, X., Gao, J., Ji, G., Liu, Z.
- Source
- Full text @ Obesity (Silver Spring)
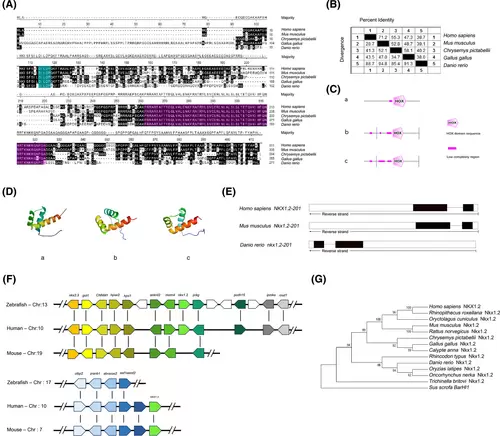
Nkx1-2 proteins have a highly conserved homeodomain. (A) Alignment of the Nkx1-2 protein sequence. Black color letters indicate the same amino acids. The homeodomain sequences were purple, whereas the -DILDP- motif sequences were blue. (B) Similarity analysis of Nkx1-2 amino acid sequences of different species. (C) SMART program was used to analyze the secondary structure of Nkx1-2 proteins. (D) SWISS-MODEL website (http://www.expasy.org/) analyzes the three-dimensional structure of the zebrafish, mice, and human Nkx1-2 proteins. (E) Comparison of gene organization of Nkx1-2 genes in different species. Boxes represent exons and horizontal lines represent introns. The coding exons were marked in black boxes, whereas the noncoding exons were white boxes. (F) Syntenic map of the Nkx1-2 genes in the chromosomes. Boxes represent genes, and transcription direction is indicated by arrow. (G) Evolutionary analysis of Nkx1-2. A phylogenetic tree was constructed using the neighbor-joining method of the MEGA 6.0 software. Each node was calculated 1000 times, and the number on the node represents the calculated percentage value. Sus scrofa BarHl1 used as the outgroup. See Table S1 for the sequence source. [Color figure can be viewed at wileyonlinelibrary.com] |
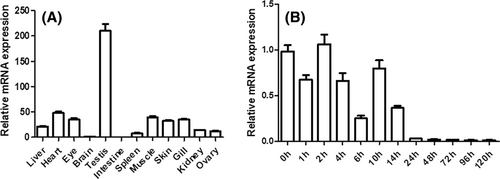
Expression pattern of nkx1.2. (A) Expression of nkx1.2 mRNA in different tissues detected by real-time PCR. (B) Expression profile of nkx1.2 at different stages of embryonic development as measured by real-time PCR. Fold difference was calculated as 2−ΔΔCt with beta-actin (Danio rerio, i.e., zebrafish) as a reference gene. Vertical bars represent the mean ± SEM (n = 3). |
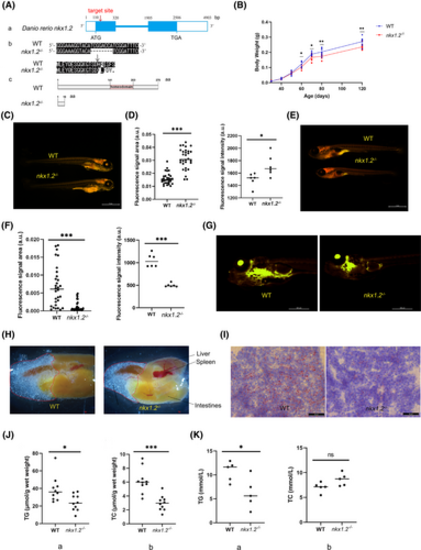
Decreased fat production in nkx1.2−/− zebrafish. (A) The generation of nkx1.2 knockout zebrafish using CRISPR/Cas9 technology. (a) The knockout gene target is located in exon 1. The box represents exons. The line represents introns. The white square represents untranslated regions. (b,c) Compared with the wild-type (WT) zebrafish, nine nucleotides were deleted in exon 1, leading to early termination of translation to the 19th amino acid. (B) Comparison of the body weight of WT and nkx1.2−/− zebrafish (n = 90). (C–F) Nile Red staining of WT and nkx1.2−/− zebrafish at 6 days post fertilization (dpf; C,D; n = 30) and 15 dpf (E,F; n = 30). The fluorescence signal was calculated by ImageJ software. (G) Nile Red staining of WT and nkx1.2−/− zebrafish at 25 dpf (n = 10). (H) The visceral mass of WT and nkx1.2−/− zebrafish (n = 8). (I) Oil red O (ORO) staining of liver tissue sections of WT and nkx1.2−/− adult zebrafish. Triglyceride (TG) and total cholesterol (TC) content in (J) liver tissues or (K) serum of WT and nkx1.2−/− zebrafish. All data were presented as mean ± SD (*p < 0.05, **p < 0.01 and ***p < 0.001; ns means no significant difference). [Color figure can be viewed at wileyonlinelibrary.com] |
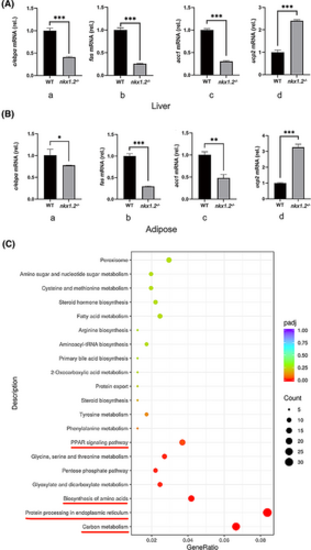
Effects of Nkx1-2 on fat metabolism in zebrafish. The expression of genes related to fatty acid metabolism in the wild-type (WT) and nkx1.2−/− zebrafish (A) liver or (B) adipose tissue detected by quantitative PCR. The beta-actin gene was used as loading control. All data were presented as mean ± SD (*p < 0.05, **p < 0.01, and ***p < 0.001). (C) Compared with WT zebrafish, the downregulated Kyoto Encyclopedia of Genes and Genomes (KEGG) pathway in liver of nkx1.2−/− zebrafish by transcriptome sequencing. [Color figure can be viewed at wileyonlinelibrary.com] |
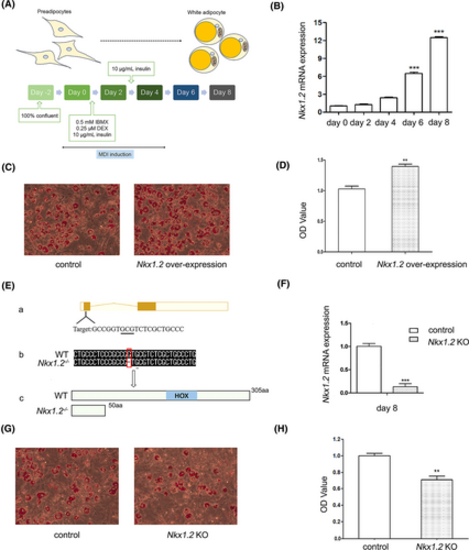
Nkx1-2 regulates the differentiation of 3T3-L1 cells. (A) The process for differentiation of 3T3-L1 preadipocytes into adipocytes. (B) The expression of nkx1.2 during the differentiation of 3T3-L1 cells. The beta-actin gene was used as loading control. (C) The effect of zebrafish nkx1.2 overexpression on 3T3-L1 differentiation. Cells were stained with Oil red O (ORO) to assess neutral lipid accumulation. (D) Absorbance value at 520 nm after isopropanol elution of ORO for B. (E) Nkx1.2 knockout (KO) 3T3-L1 cells were generated. The knockout gene target is located in exon 1. The box represents exons. The line represents introns. The white square represents untranslated regions. Compared with the wild type (WT), one nucleotide was deleted in the mutant, leading to early termination of translation to the 50th amino acid. (F) The expression of nkx1.2 mRNA decreases after nkx1.2 knockout. (G) Effect of nkx1.2 knockout on 3T3-L1 cell differentiation. (H) Absorbance value at 520 nm after isopropanol elution of ORO for F. All data were presented as mean ± SD (**p < 0.01 and ***p < 0.001). [Color figure can be viewed at wileyonlinelibrary.com] |

Zebrafish Nkx1-2 binds to cebpa promoter and activates its transcription. (A) The effect of zebrafish nkx1.2 overexpression on cebpa expression during 3T3-L1 differentiation. The beta-actin gene was used as loading control. (B) Effect of nkx1.2 knockout on cebpa expression during 3T3-L1 differentiation. The beta-actin gene was used as loading control. (C) Cebpa promoter activity analysis. The reporter gene vector (pGL3 promoter) and the internal reference plasmid (pRL-TK) containing promoter sequences of different lengths were co-transfected into HEK293T cells. After 48 h, a double luciferase reporter gene detection experiment was performed. C2000, C1000, and C500 represent 2000 bp, 1000 bp, and 500 bp of pGL3-cebpa-promoter, respectively. (a) 2000 bp, 1000 bp, and 500 bp diagrams of C/EBPα promoter. (b) C/EBPα promoter activity detection. (D) Regulating effect of full-length and truncated Nkx1-2 on cebpa promoter by the double luciferase reporter gene assay. (E) Regulation analysis of truncated cebpa promoter by Nkx1-2. HEK 293T cells were co-transfected with pcDNA3.1-nkx1.2 expression vector and pGL3-cebpa-promoter reporter gene vector, and the activity of dual luciferase was detected 48 h later. (a) 500 bp, 1000 bp, 1500 bp, 1800 bp, and 2000 bp diagrams of cebpa promoter. (b-f) Activity detection of different lengths of cebpa promoter by Nkx1-2. (F) Mutation of the cebpa promoter to analyze the binding sites of Nkx1-2. (a) Prediction of Nkx1-2 binding sites in cebpa promoter. (b) Analysis of cebpa promoter activity after mutation. (c) The mutation promoter reporter gene expression vector and nkx1.2 expression vector were co-transfected into HEK293T cells, and the luciferase activity was detected. (G) Prokaryotic expression and purification of zebrafish Nkx1-2 protein. M: Marker; lane 1: total Escherichia coli protein before isopropyl ß-D-1-thiogalactopyranoside (IPTG) induction; lane 2: total E. coli protein after IPTG induction; lane 3: protein supernatant; lane 4: inclusion body; lane 5: Nkx1-2 recombinant protein after ultrafiltration; lane 6: purified protein detected by Western blot. (H) Electrophoretic mobility shift assay (EMSA) test to show the binding of Nkx1-2 to cebpa promoter. 1: Negative control; 2: positive control; 3: an excess unlabeled competitor probe; 4: an excess unlabeled competitor probe containing a mutated runt binding site. All data were presented as mean ± SD (*p < 0.05, **p < 0.01, and ***p < 0.001; ns means no significant difference). [Color figure can be viewed at wileyonlinelibrary.com] |
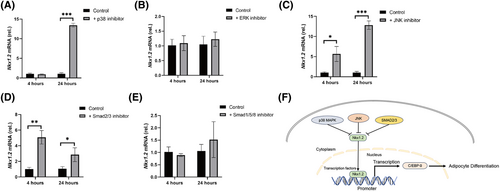
p38 MAPK, JNK, and Smad2/3 signaling pathways regulate the expression of nkx1.2. Nkx1.2 expression in 3T3-L1 cells treated with (A) p38 inhibitor, (B) ERK inhibitor, (C) JNK inhibitor, (D) Smad2/3 inhibitor, or (E) Smad1/5/8 inhibitor for 4 h and 24 h, respectively. (F) A model for the molecular mechanism by which Nkx1-2 regulates the adipogenesis. The beta-actin gene was used as loading control. Data were presented as mean ± SD. Data were analyzed by one-way ANOVA (*p < 0.05, **p < 0.01, ***p < 0.001). [Color figure can be viewed at wileyonlinelibrary.com] |
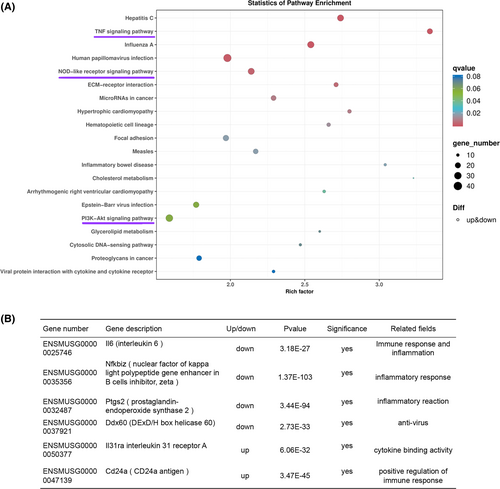
Nkx1-2 regulates the immune pathways in 3T3-L1 cells. (A) Transcriptome sequence was performed on wild-type (WT) and Nkx1-2−/− 3T3-L1 cells. After induction of adipogenic differentiation (8 days), Kyoto Encyclopedia of Genes and Genomes (KEGG) pathways of the differentially expressed genes (DEGs) in 3T3-L1 cells. (B) Examples of DEGs related to immune process between WT and nkx1.2−/− 3T3-L1 cells. [Color figure can be viewed at wileyonlinelibrary.com] |

Unillustrated author statements PHENOTYPE:
|