
Fig. 3
- ID
- ZDB-IMAGE-240628-30
- Publication
- Wang et al., 2024 - Nkx1.2 deletion decreases fat production in zebrafish
- All Figures
- Figures for Wang et al., 2024
|
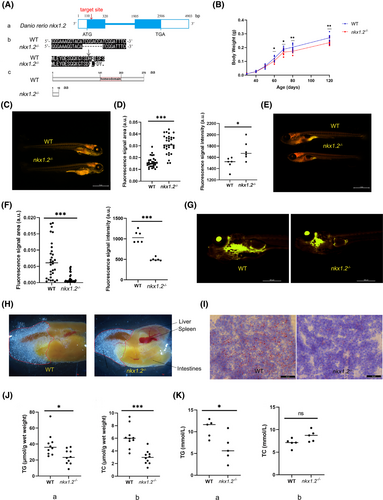
Fig. 3 Decreased fat production in nkx1.2−/− zebrafish. (A) The generation of nkx1.2 knockout zebrafish using CRISPR/Cas9 technology. (a) The knockout gene target is located in exon 1. The box represents exons. The line represents introns. The white square represents untranslated regions. (b,c) Compared with the wild-type (WT) zebrafish, nine nucleotides were deleted in exon 1, leading to early termination of translation to the 19th amino acid. (B) Comparison of the body weight of WT and nkx1.2−/− zebrafish (n = 90). (C–F) Nile Red staining of WT and nkx1.2−/− zebrafish at 6 days post fertilization (dpf; C,D; n = 30) and 15 dpf (E,F; n = 30). The fluorescence signal was calculated by ImageJ software. (G) Nile Red staining of WT and nkx1.2−/− zebrafish at 25 dpf (n = 10). (H) The visceral mass of WT and nkx1.2−/− zebrafish (n = 8). (I) Oil red O (ORO) staining of liver tissue sections of WT and nkx1.2−/− adult zebrafish. Triglyceride (TG) and total cholesterol (TC) content in (J) liver tissues or (K) serum of WT and nkx1.2−/− zebrafish. All data were presented as mean ± SD (*p < 0.05, **p < 0.01 and ***p < 0.001; ns means no significant difference). [Color figure can be viewed at wileyonlinelibrary.com]