
IMAGE
Fig. 2
- ID
- ZDB-IMAGE-240628-29
- Genes
- Publication
- Wang et al., 2024 - Nkx1.2 deletion decreases fat production in zebrafish
- All Figures
- Figures for Wang et al., 2024
Image
|
Figure Caption
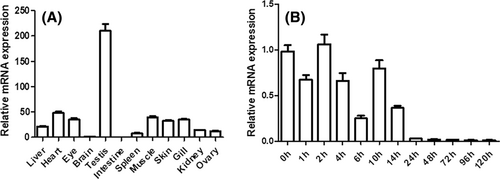
Fig. 2 Expression pattern of nkx1.2. (A) Expression of nkx1.2 mRNA in different tissues detected by real-time PCR. (B) Expression profile of nkx1.2 at different stages of embryonic development as measured by real-time PCR. Fold difference was calculated as 2−ΔΔCt with beta-actin (Danio rerio, i.e., zebrafish) as a reference gene. Vertical bars represent the mean ± SEM (n = 3).
Figure Data
Acknowledgments
This image is the copyrighted work of the attributed author or publisher, and
ZFIN has permission only to display this image to its users.
Additional permissions should be obtained from the applicable author or publisher of the image.
Full text @ Obesity (Silver Spring)