- Title
-
Mycobacterial CpsA activates type I IFN signaling in macrophages via cGAS-mediated pathway
- Authors
- Ding, Y., Tong, J., Luo, G., Sun, R., Bei, C., Feng, Z., Meng, L., Wang, F., Zhou, J., Chen, Z., Li, D., Fan, Y., Song, S., Wang, D., Feng, C.G., Liu, H., Chen, Q., Yan, B., Gao, Q.
- Source
- Full text @ iScience
|
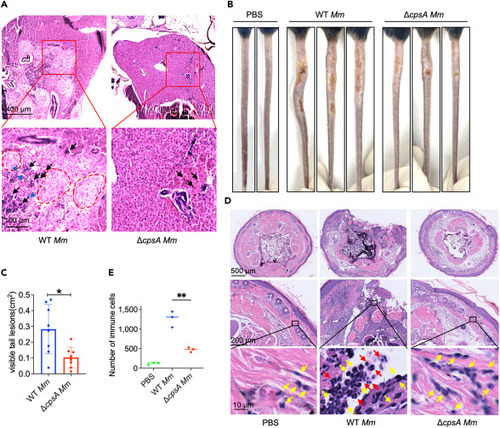
CpsA is required for histopathological injury both in zebrafish and mouse tail infection models (A) Histopathology of the infected zebrafish at 8 dpi with WT Mm or ΔcpsA Mm. Infected fish were subjected to histological analysis with hematoxylin and eosin (H&E) staining. Black arrows indicate infiltrated inflammation cells. Blue arrowheads indicate necrosis cells. Red circle region indicates the granuloma. The analysis was conducted using two fish per group, with two samples per fish, and three sections examined per sample. (B) C57BL/6J mice were infected with WT Mm or ΔcpsA Mm via tail vein injection, PBS as control. Whole tails were photographed at 10 dpi. (C) The total area of visible tail lesions were calculated by measuring the length and width of lesions. Data were shown as mean size ± SEM (n = 8), ∗p < 0.05 by Mann-Whitney rank-sum test. (D) Representative histopathology images of tails from WT Mm or ΔcpsA Mm-infected C57BL/6J mice at 10 dpi. Uninfected and infected tails were subjected to histological analysis with H&E staining. Yellow arrows indicate infiltrated macrophages and red arrows indicate infiltrated neutrophils. (E) The infiltrated immune cells in histopathology images of mice tails were counted. The analysis was performed using three mice per group, with two samples from different tissues per mouse, and three sections examined per sample. Data were shown as mean size ± SEM, ∗∗p < 0.01 by one-way ANOVA. |
|
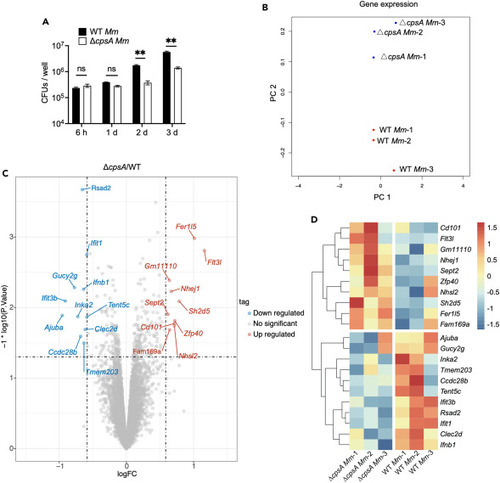
Results of RNA-seq analysis and differentially expressed genes (A) Colony-forming unit (CFU) counts of intracellular bacteria in RAW264.7 macrophages infected with WT Mm and ΔcpsA Mm with MOI of 10. Data are representative of three independent experiments and values are presented as means ± SEM. ∗∗p < 0.01 by two-way ANOVA with multiple comparisons. (B) Multidimensional scaling between WT Mm and ΔcpsA Mm-infected RAW264.7 macrophages. Each group has three biological replicates. (C) Volcano plot of macrophage differentially expressed genes (DEGs). Colored plots stand for genes with significant differences (p < 0.05). Red plots stand for upregulated genes of RAW264.7 infected with ΔcpsA Mm compared to WT Mm while blue plots stand for downregulated genes. The x axis represented log2 of fold change and the y axis represented the log10 of p values. (D) Heatmap showing the expression profile of selected DEGs with higher expression in WT Mm than ΔcpsA Mm infection. The gene expression levels were normalized using the Z score method. The color of each block represents the Z score value of gene expression, which indicates the degree of deviation of each gene across all samples relative to the average expression of that gene across all samples. |
|
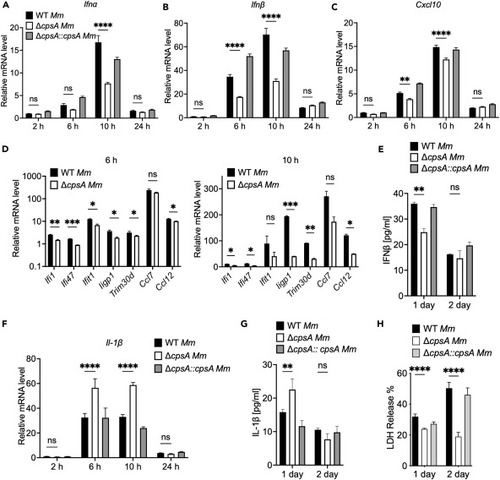
Induction of type I IFNs and ISGs in RAW264.7 cells are dependent on CpsA RAW264.7 cells were infected with WT, ΔcpsA, and the complemented strains at MOI of 10. RNA was isolated at 2, 6, 10, and 24 hpi. (A) Ifnα (the primers detected the combined expression of Ifnα subtype 1 and Ifnα subtype 7), (B) Ifnβ, (C) Cxcl10, and (F) Il-1β levels were determined by RT-qPCR, and values were normalized to Gapdh and WT strain at 2 hpi. (D) RAW264.7 cells were infected with WT, ΔcpsA Mm strains at MOI of 10. RNA was isolated at 6 and 10 hpi. The mRNA levels of Ifi1, Ifi47, Ifit1, Iigp1, Trim30d, Ccl7, and Ccl12 were determined by RT-qPCR, and values were normalized to Gapdh and uninfected RAW264.7 cells. (E) Supernatants were collected from infections at 1 dpi and 2 dpi and were subjected to ELISA for analysis of IFNβ protein concentration. (G) Supernatants were collected from infections at 1 dpi and 2 dpi and were subjected to ELISA for analysis of IL-1β protein concentration. (H) RAW264.7 cells infected with WT, ΔcpsA, and the complemented strains at MOI of 10 were analyzed by LDH release assay. Shown is a representative experiment of three (n = 3). Data represent means ± SEM of three independent experiments. ∗p < 0.05; ∗∗p < 0.01; ∗∗∗p < 0.001; ∗∗∗∗p < 0.0001; ns, not significant. Two-way ANOVA with multiple comparisons test for A, B, C, E, F, G, and H, unpaired t tests for D. |
|
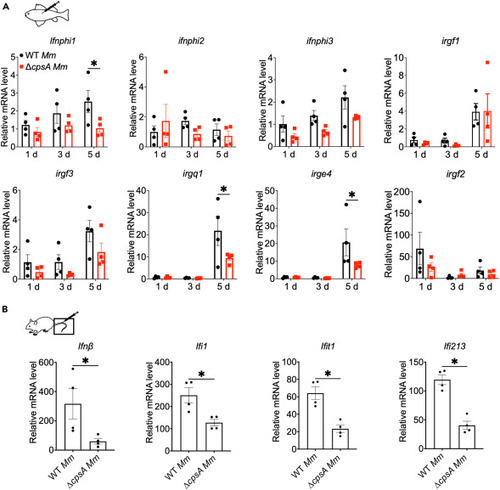
CpsA-dependent type I IFNs and ISGs activation in vivo (A) Adult zebrafishes were infected with WT or ΔcpsA Mm strains (104 CFU) and the mRNA levels of type I IFNs and ISGs of the fish body were determined by RT-qPCR and normalized to gapdh. (B) C57BL/6J mice were infected with WT, ΔcpsA Mm strain (∼3 × 10⁸ CFU/mouse) via tail vein injection. The mRNA levels of type I IFNs and ISGs of the tail were determined by RT-qPCR. In A and B, data shown are mean fold increase over PBS-treated animals ± SEM. A, ∗p < 0.05 by two-way ANOVA with multiple comparisons test, and B, ∗p < 0.05 by unpaired t tests. |
|
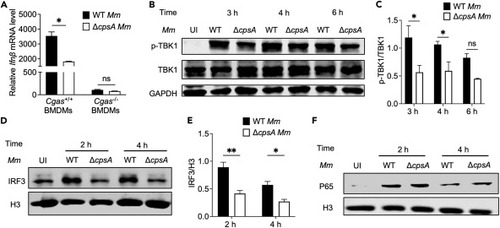
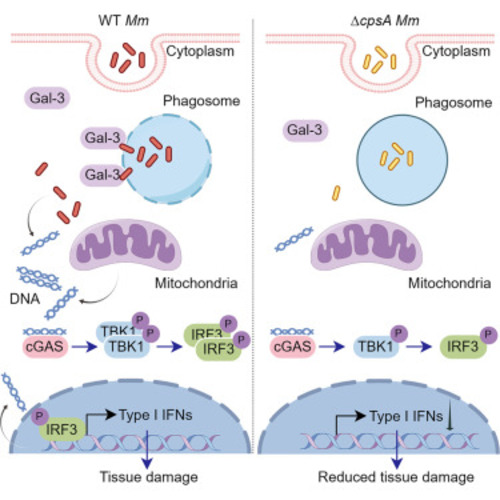
CpsA-related type I IFN production is through cGAS-TBK1-IRF3 pathway (A) BMDMs extracted from WT mice or Cgas knockout mice were infected with WT or ΔcpsA Mm strains at MOI of 10. RNA was isolated at 10 h after infection. Ifnβ levels were determined by RT-qPCR in different infection cells; values were normalized to Gapdh and uninfected BMDMs. (B) RAW264.7 cells were infected with WT and ΔcpsA strains at MOI of 10. Total cell lysates and nuclear part were harvested at indicated time points. Phospho-TBK1 and TBK1 protein levels were determined by using a densitometer and (C) corresponding statistical results were calculated from two independent experiments by ImageJ software, GAPDH as a reference protein. (D) The protein levels of IRF3 from nuclear fraction were determined by western blot (WB) and (E) corresponding statistical results were calculated from two independent experiments by ImageJ software, H3 as a reference. (F) Nuclear p65 and H3 protein levels were determined by WB. Shown is a representative experiment of three. Data represent means ± SD of three independent experiments. A, ∗p < 0.05, ns, not significant by unpaired t test, and C, D ∗p < 0.05, ∗∗p < 0.01, ns, not significant by two-way ANOVA with multiple comparisons test. |
|
CpsA is required for the recruitment of galectin-3 to the Mm containing phagosomes followed by release of host and bacterial-derived DNA to the cytosol (A) The levels of mitochondrial (D loop1), nuclear (Tert), or Mm (furA) DNA in the cytosolic compartment of RAW264.7 cells infected with WT or ΔcpsA Mm were analyzed by qPCR as described in materials and methods. Data represent means ± SD. ∗∗∗∗p < 0.0001 by unpaired t test. (B) The mitochondrial protein TIMM44 and nuclear protein Histone H3 were analyzed in whole-cell lysates (WCL) and cytosolic fractions (CYT) by WB. GAPDH was used as a loading control. (C) Immunofluorescence of RAW264.7 cells infected with Wasabi labeled WT, ΔcpsA, the complemented strains, and ΔRD1 Mm at MOI of 10 for 4 hpi with uninfected group as control and imaged after staining with anti-galectin-3 (red). Scale bar, 10 μm. White arrows indicate the colocalization of galectin-3 with bacteria. (D) Quantification of Mm and galectin-3 colocalization in (C). A minimum of 200 cells were quantified per group. The images were representative of three independent experiments. Data represent means ± SD of three independent experiments. ∗∗∗∗p < 0.0001 by one-way ANOVA. |
|
|

