
|
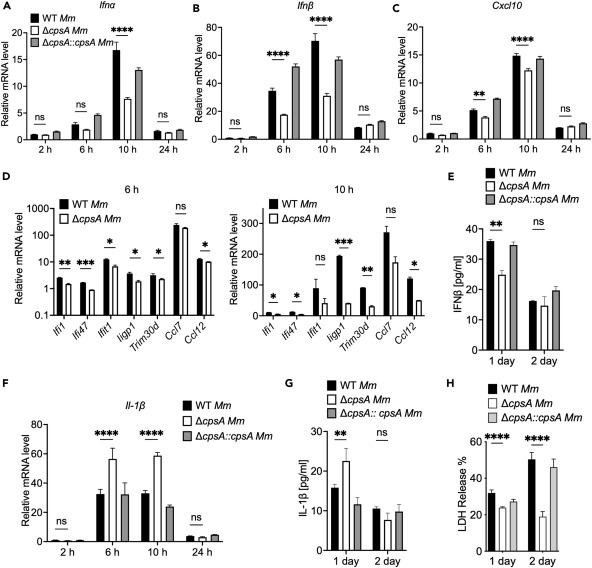
Fig. 3 Induction of type I IFNs and ISGs in RAW264.7 cells are dependent on CpsA RAW264.7 cells were infected with WT, ΔcpsA, and the complemented strains at MOI of 10. RNA was isolated at 2, 6, 10, and 24 hpi. (A) Ifnα (the primers detected the combined expression of Ifnα subtype 1 and Ifnα subtype 7), (B) Ifnβ, (C) Cxcl10, and (F) Il-1β levels were determined by RT-qPCR, and values were normalized to Gapdh and WT strain at 2 hpi. (D) RAW264.7 cells were infected with WT, ΔcpsA Mm strains at MOI of 10. RNA was isolated at 6 and 10 hpi. The mRNA levels of Ifi1, Ifi47, Ifit1, Iigp1, Trim30d, Ccl7, and Ccl12 were determined by RT-qPCR, and values were normalized to Gapdh and uninfected RAW264.7 cells. (E) Supernatants were collected from infections at 1 dpi and 2 dpi and were subjected to ELISA for analysis of IFNβ protein concentration. (G) Supernatants were collected from infections at 1 dpi and 2 dpi and were subjected to ELISA for analysis of IL-1β protein concentration. (H) RAW264.7 cells infected with WT, ΔcpsA, and the complemented strains at MOI of 10 were analyzed by LDH release assay. Shown is a representative experiment of three (n = 3). Data represent means ± SEM of three independent experiments. ∗p < 0.05; ∗∗p < 0.01; ∗∗∗p < 0.001; ∗∗∗∗p < 0.0001; ns, not significant. Two-way ANOVA with multiple comparisons test for A, B, C, E, F, G, and H, unpaired t tests for D.