Fig. 2
- ID
- ZDB-FIG-240611-29
- Publication
- Ding et al., 2024 - Mycobacterial CpsA activates type I IFN signaling in macrophages via cGAS-mediated pathway
- Other Figures
- All Figure Page
- Back to All Figure Page
|
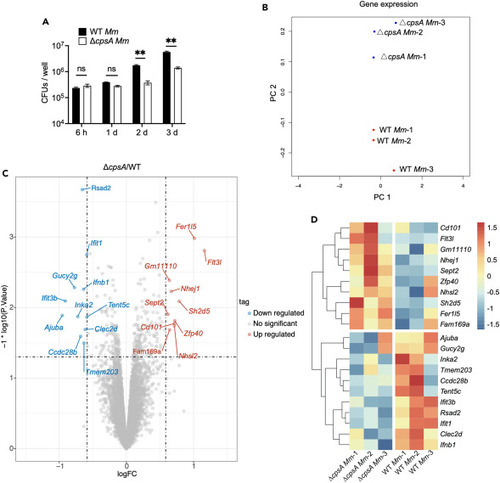
Results of RNA-seq analysis and differentially expressed genes (A) Colony-forming unit (CFU) counts of intracellular bacteria in RAW264.7 macrophages infected with WT Mm and ΔcpsA Mm with MOI of 10. Data are representative of three independent experiments and values are presented as means ± SEM. ∗∗p < 0.01 by two-way ANOVA with multiple comparisons. (B) Multidimensional scaling between WT Mm and ΔcpsA Mm-infected RAW264.7 macrophages. Each group has three biological replicates. (C) Volcano plot of macrophage differentially expressed genes (DEGs). Colored plots stand for genes with significant differences (p < 0.05). Red plots stand for upregulated genes of RAW264.7 infected with ΔcpsA Mm compared to WT Mm while blue plots stand for downregulated genes. The x axis represented log2 of fold change and the y axis represented the log10 of p values. (D) Heatmap showing the expression profile of selected DEGs with higher expression in WT Mm than ΔcpsA Mm infection. The gene expression levels were normalized using the Z score method. The color of each block represents the Z score value of gene expression, which indicates the degree of deviation of each gene across all samples relative to the average expression of that gene across all samples. |

