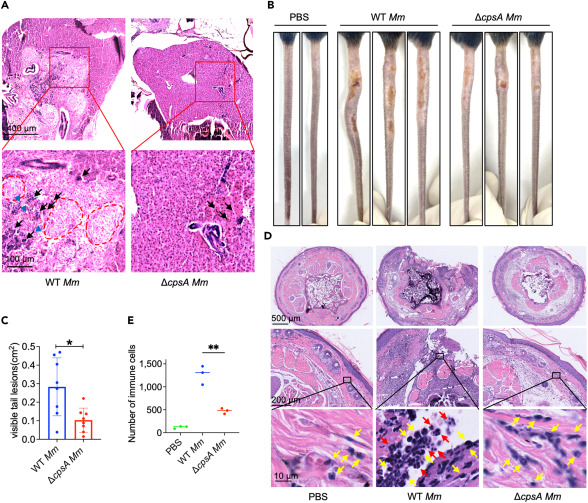
Fig. 1 CpsA is required for histopathological injury both in zebrafish and mouse tail infection models (A) Histopathology of the infected zebrafish at 8 dpi with WT Mm or ΔcpsA Mm. Infected fish were subjected to histological analysis with hematoxylin and eosin (H&E) staining. Black arrows indicate infiltrated inflammation cells. Blue arrowheads indicate necrosis cells. Red circle region indicates the granuloma. The analysis was conducted using two fish per group, with two samples per fish, and three sections examined per sample. (B) C57BL/6J mice were infected with WT Mm or ΔcpsA Mm via tail vein injection, PBS as control. Whole tails were photographed at 10 dpi. (C) The total area of visible tail lesions were calculated by measuring the length and width of lesions. Data were shown as mean size ± SEM (n = 8), ∗p < 0.05 by Mann-Whitney rank-sum test. (D) Representative histopathology images of tails from WT Mm or ΔcpsA Mm-infected C57BL/6J mice at 10 dpi. Uninfected and infected tails were subjected to histological analysis with H&E staining. Yellow arrows indicate infiltrated macrophages and red arrows indicate infiltrated neutrophils. (E) The infiltrated immune cells in histopathology images of mice tails were counted. The analysis was performed using three mice per group, with two samples from different tissues per mouse, and three sections examined per sample. Data were shown as mean size ± SEM, ∗∗p < 0.01 by one-way ANOVA.
Image
Figure Caption
Acknowledgments
This image is the copyrighted work of the attributed author or publisher, and
ZFIN has permission only to display this image to its users.
Additional permissions should be obtained from the applicable author or publisher of the image.
Full text @ iScience

