
- Title
-
Ultrahigh field diffusion magnetic resonance imaging uncovers intriguing microstructural changes in the adult zebrafish brain caused by Toll-like receptor 2 genomic deletion
- Authors
- Singer, R., Oganezova, I., Hu, W., Liu, L., Ding, Y., de Groot, H.J.M., Spaink, H.P., Alia, A.
- Source
- Full text @ NMR Biomed.

Comparison of brain structure and volume in tlr2−/− and control adult zebrafish. (A) Representative sagittal and coronal slices of DTI of control and tlr2−/−adult zebrafish obtained at 17.6 T. (B) 2D and 3D representation of the zebrafish brain, divided into its main regions, providing a comprehensive view of its anatomical organisation. (C) Comparison of the cortical thickness of the TL, the CCem and TeO shows a significant increase in tlr2−/− zebrafish compared with controls. Furthermore, significant increases in the volume of the CB and RC were observed. In all other brain regions, as for the total brain volume, a similar trend is observed, albeit nonsignificantly (p > 0.05). Acquisition details: TR 2000 ms, TE 9 ms, 4 averages, isotropic resolution 35 μm, effective b-value range of 100, 1000 or 2500 s/mm2, with 4, 12 and 24 directions, respectively. Statistical analysis was performed using the unpaired t-test, assuming Gaussian distribution, with p less than 0.05 considered to imply significant differences between the control and the tlr2−/− group. CB, cerebellum; CCem, molecular layer of the cerebellar corpus; DC, diencephalon; DTI, diffusion tensor imaging; MC, mesencephalon; OB, olfactory bulb; Pa, pallium; RC, rhombencephalon; TeO, optic tectum; TL, longitudinal torus. |

T2 relaxation time and ADC measurement in various brain regions of control and tlr2 mutant (tlr2−/−) zebrafish. (A) Anatomical DWI (b-value 1000 s/mm2), sagittal slice, showing ROIs used for T2 and ADC estimation. (B) Estimated T2 relaxation times in selected ROIs of control and tlr2−/− zebrafish. (C) Estimated ADC in selected ROIs of control and tlr2−/− zebrafish. Acquisition details for MSME: TR 3000, τ 6.0 ms, 4 averages, resolution 47 × 47 μm and a slice thickness of 500 μm; and for DWI: TR 1000 ms, TE 13 ms, 4 averages, resolution 47 × 47 μm, slice thickness 200 μm and effective b-value range 50, 500, 1000, 1500, 2000, 2500 or 3000 s/mm2. Statistical analysis was performed using the unpaired t-test, assuming Gaussian distribution, with p less than 0.05 considered to imply significant differences between the control and the tlr2−/− group. *p < 0.05, **p < 0.01, ****p < 0.001. ADC, apparent diffusion coefficient; CCeg, granular layer of the cerebellar corpus; CCem, molecular layer of the cerebellar corpus; DIL, diffuse nucleus of the inferior lobe; DM, medial zone of the dorsal telencephalon; DWI, diffusion-weighted imaging; MLF, medial longitudinal fascicle; MSME, multislice multiecho; ROI, region of interest; TL, longitudinal torus. |

Phasor analysis of the experimental ADC curves. (A) Phasor plot of the CCem of tlr2−/− and control, relative to the phasor plot semicircle (red). On the semicircle, 0 mm2/s is located at [0,0], with steps of 1·10−4 mm2/s indicated as red dots on the semicircle. (B) Monocomponent analysis shows that the ADC in tlr2−/− is significantly reduced, while (C–E) Multicomponent analysis of the ADC decay curve in the CCem shows a significant increase in the area of the slow diffusion component in tlr2−/−, associated with restricted diffusion. Acquisition details for the DWI used for phasor plot analysis: TR 1000 ms, TE 13 ms, 4 averages, resolution 47 × 47 μm, slice thickness 200 μm and effective b-value range 50, 500, 1000, 1500, 2000, 2500 or 3000 s/mm2. Statistical analysis was performed using the unpaired t-test, assuming Gaussian distribution, with p less than 0.05 considered to imply significant differences between the control and the tlr2−/− group. * p < 0.05. ADC, apparent diffusion coefficient; CCem, molecular layer of the cerebellar corpus; DWI, diffusion-weighted imaging. |
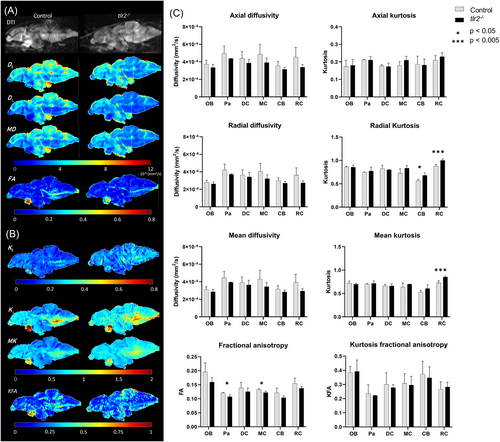
Comparison of DTI results in the main brain regions of tlr2−/− and control adult zebrafish. Representative central slice of DTI measurements of control and tlr2−/− adult zebrafish. (A) From these slices, the diffusion tensor metrics were estimated: D∥, D⊥, MD and FA, as well as (B) the diffusion kurtosis metrics: K∥, K⊥, MK and KFA. (C) DTI and DKI results of tlr2−/− adult zebrafish compared with controls reveal a noteworthy trend towards decreased D∥, D⊥ and MD, reduced FA, as well as increased K∥, K⊥ and MK. Additionally, a significant decrease in KFA is observed in the tlr2−/− group. Acquisition details: TR 2000 ms, TE 12.4 ms, 32 averages, resolution 25 × 25 × 200 μm, effective b-value range 4, 1000, 3500 or 6000 s/mm2, with 8, 12, 24 or 36 directions, respectively. Statistical analysis was performed using the unpaired t-test, assuming Gaussian distribution, with p less than 0.05 considered to imply significant differences between the control and the tlr2−/− group. *p < 0.05, ***p < 0.005. CB, cerebellum; D∥, axial diffusivity; D⊥, radial diffusivity; DC, diencephalon; DKI, diffusion kurtosis imaging; DTI, diffusion tensor imaging; FA, fractional anisotropy; K∥, axial kurtosis; K⊥, radial kurtosis; KFA, kurtosis fractional anisotropy; MC, mesencephalon; MD, mean diffusivity; MK, mean kurtosis; OB, olfactory bulb; Pa, pallium; RC, rhombencephalon. |
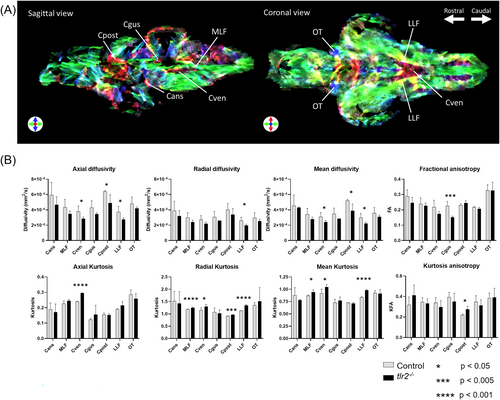
Comparison of DTI results of white matter structures of tlr2−/− and control adult zebrafish. (A) Sagittal and coronal slices of the DEC stTDI msmt-CSD map, used for the identification of white matter structures in the zebrafish brain. Acquisition details: TR 2000 ms, TE 9 ms, 4 averages, isotropic resolution 35 μm, effective b-value range 100, 1000 or 2500 s/mm2, with 4, 12 and 24 directions, respectively. (B) Diffusion metrics estimated by DTI results show reduced D∥, D⊥ and MD, reduced FA, increased K∥, K⊥ and MK and KFA in white matter structures in the tlr2−/− zebrafish brain. Acquisition details: TR 2000 ms, TE 12.4 ms, 32 averages, resolution 25 × 25 × 200 μm, effective b-value range 4, 1000, 3500 or 6000 s/mm2, with 8, 12, 24 or 36 directions, respectively. Statistical analysis was performed using the unpaired t-test, assuming Gaussian distribution, with p less than 0.05 considered to imply significant differences between the control and the tlr2−/− group. *p < 0.05, ***p < 0.005, ****p < 0.001. Cans, ansulate commissure; Cgus, commissure of the secondary gustatory nuclei; Cpost, posterior commissure; CSD, constraint spherical deconvolution; Cven, ventral rhombencephalic commissure; D∥, axial diffusivity; D⊥, radial diffusivity; DEC, directional encoded colour; DTI, diffusion tensor imaging; FA, fractional anisotropy; K∥, axial kurtosis; K⊥, radial kurtosis; KFA, kurtosis fractional anisotropy; LLF, lateral longitudinal fascicle; MD, mean diffusivity; MK, mean kurtosis; MLF, medial longitudinal fascicle; msmt, multishell multitissue; OT, optic tract; stTDI, short-track track-density imaging. |