
|
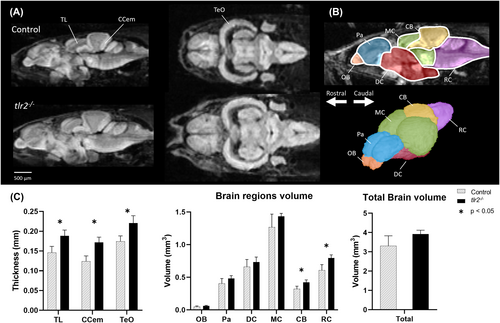
Fig. 1 Comparison of brain structure and volume in tlr2−/− and control adult zebrafish. (A) Representative sagittal and coronal slices of DTI of control and tlr2−/−adult zebrafish obtained at 17.6 T. (B) 2D and 3D representation of the zebrafish brain, divided into its main regions, providing a comprehensive view of its anatomical organisation. (C) Comparison of the cortical thickness of the TL, the CCem and TeO shows a significant increase in tlr2−/− zebrafish compared with controls. Furthermore, significant increases in the volume of the CB and RC were observed. In all other brain regions, as for the total brain volume, a similar trend is observed, albeit nonsignificantly (p > 0.05). Acquisition details: TR 2000 ms, TE 9 ms, 4 averages, isotropic resolution 35 μm, effective b-value range of 100, 1000 or 2500 s/mm2, with 4, 12 and 24 directions, respectively. Statistical analysis was performed using the unpaired t-test, assuming Gaussian distribution, with p less than 0.05 considered to imply significant differences between the control and the tlr2−/− group. CB, cerebellum; CCem, molecular layer of the cerebellar corpus; DC, diencephalon; DTI, diffusion tensor imaging; MC, mesencephalon; OB, olfactory bulb; Pa, pallium; RC, rhombencephalon; TeO, optic tectum; TL, longitudinal torus.