FIGURE SUMMARY
Title

Somatic PDGFRB activating variants promote smooth muscle cell phenotype modulation in intracranial fusiform aneurysm

Authors
Hao, L., Ya, X., Wu, J., Tao, C., Ma, R., Zheng, Z., Mou, S., Ling, Y., Yang, Y., Wang, J., Zhang, Y., Lin, Q., Zhao, J.
Source
Full text @ J. Biomed. Sci.

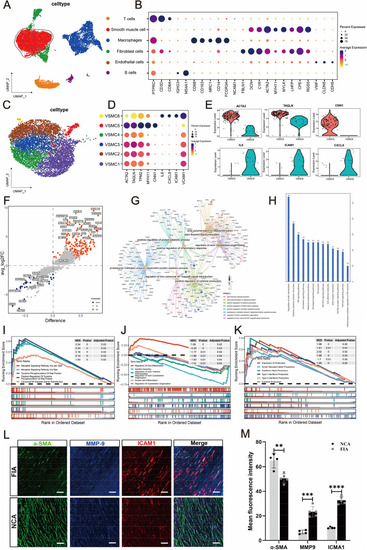
Single-cell transcriptional profiling of intracranial fusiform aneurysmal cells (A-K) and multi-color immunofluorescence (mIF) of smooth muscle cells (SMCs) markers and inflammatory markers between intracranial fusiform aneurysms (IFAs) and normal cerebral arteries (NCAs) (L-M). T-SNE visualization of intracranial fusiform aneurysmal cells type. Colored according to cell type (A). Visualization of specific gene expression patterns related to cell subsets identified in (A) using a bubble plot (B). T-SNE visualization of VSMC cell clusters. Colored according to clusters (C). Visualization of structural protein and inflammation-related genes expression patterns within the subsets of smooth muscle cells identified in (C) using a bubble plot (D). The violin plots show the expression differences of structural protein genes and inflammatory genes between the contraction subgroup (VSMC5) and the inflammatory subgroup (VSMC6) (E). The volcano plot specifically shows the gene expression differences between the two cell groups (F). The petal plot displays the GO enrichment analysis results of differential genes between the VSMC5 and VSMC6 (G). The bar graph shows the KEGG enrichment analysis results of differential genes between these two cell subsets (H). The GSEA enrichment analysis results of differential genes between the two groups. The enrichment results of differential genes related to signaling pathways (I). The enrichment results of differential genes related to structural protein genes (J). The enrichment results of differential genes related to the process of inflammatory factor secretion (K). α-SMA (green, SMCs marker), MMP-9 (blue, inflammatory marker) and ICAM-1 (red, inflammatory marker) in FIAs and NCAs are detected using mIF. Scale bar, 100 μm (L). Statistical analysis of mean fluorescence intensity about SMCs marker (α-SMA) and inflammatory markers (ICAM-1 and MMP-9) between NCAs (n = 4) and FIAs (n = 5). 'n' represented the number of samples. Three random fields were selected for statistical analysis in each sample, and the average value represented the detection value of this marker in this sample. The Student's t-test is utilized to examine the statistical differences among each marker. ns, no significant; **p < 0.01, ***p < 0.01 (M). n values indicate number of independent experiments performed

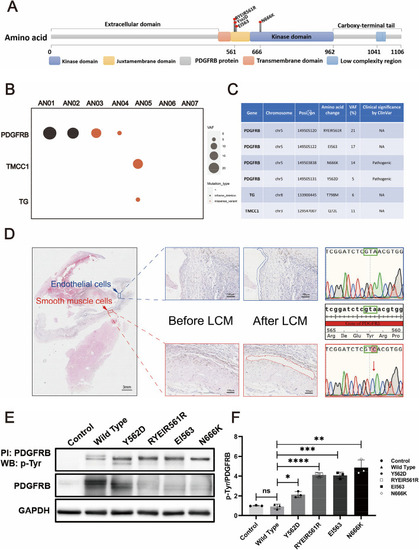
Somatic mutational landscape of FIAs. Structure of the protein encoded by PDGFRβ and the lollipop plots illustrate the location of the identified mutations in our cohort. The color of the boxes denotes different regions of the encoded protein. The coordinates represent the n-th amino acids (A). Somatic mutational landscape of 7 FIA samples with paired blood. The x-axis and y-axis specify the gene name and sample ID, respectively. The size of the circle represents the variant allele frequency. And the color denotes different types of mutations (B). Clinical significance of the detected somatic mutations according to the ClinVar database (C). The smooth muscle layer and endothelial layer in the FIA sections are dissected by laser-capture microdissection (LCM). PDGFRB.Y562D mutation is found in smooth muscle layer by Sanger sequencing (D). HBVSMCs with PDGFRB mutations identified by WES are constructed and these mutations are found to have a characteristic with gain-of-function by immunoprecipitation (E). The scatter bar graph is shown the relative density of immunoblot bands (normalized to those in cells transfected vector) about pTyr/PDGFRβ in cells expressing different PDGFRB mutations is shown in (F) (n = 3). ‘n’ represents three repeated experiments. The Student's t-test was employed to assess the differences in pTyr/PDGFRβ levels between different mutant groups and the Wild Type group, with Bonferroni correction for multiple comparisons. n values represent the number of repeated experiments. ns, no significant, **padj < 0.01, ***padj < 0.001

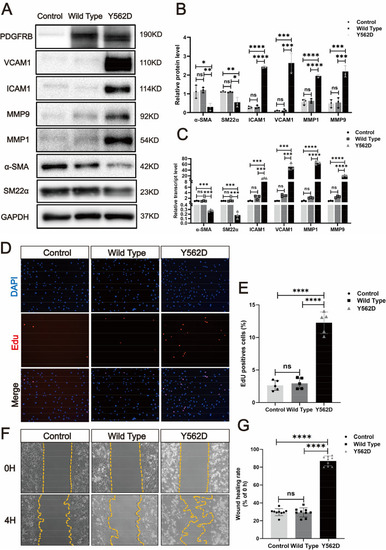
PDGFRB somatic mutation induce phenotypic modulation in SMCs. Immunostaining reveals the expression levels of smooth muscle markers (a-SMA and SM22a) and inflammatory markers (VCAM1, ICAM1, MMP1 and MMP9) in HBVSMCs transfected with different viruses (Control: vector; Wild Type: PDGFRB; Y562D: PDGFRBY562D) (a). The relative density of immunoblot bands about markers shown in (A) were display (B) (normalized to those in cells transfected with vector viruses). RT-qPCR (C) of SMCs markers (α-SMA and SM22α) and inflammatory markers (VCAM-1, ICAM1, MMP-9 and MMP-1) in HBVSMCs underwent different treatments. Student's t-test and Benjamini–Hochberg correction are employed to assess the statistical significance. Edu assay exhibit the proliferation ability of HBVSMCs under different treatment conditions (D). Statistical analysis of the proportion of Edu-positive cells in the different groups from 5 different fields of each group at × 200 magnification. Tukey's multiple comparisons test is used for statistical differences (E). Scratch assay displays migratory ability of HBVSMCs underwent different treatment (F). Statistical analysis of the rate of wound healing (reduced area at 4H /area at 0H) in the different groups from 9 different fields of each group at × 200 magnification. Tukey's multiple comparisons test is utilized to evaluate the statistical significance. *padj < 0.05, **padj < 0.01, ***padj < 0.001, ****padj < 0.0001 (G). The above experiments are all repeated three times

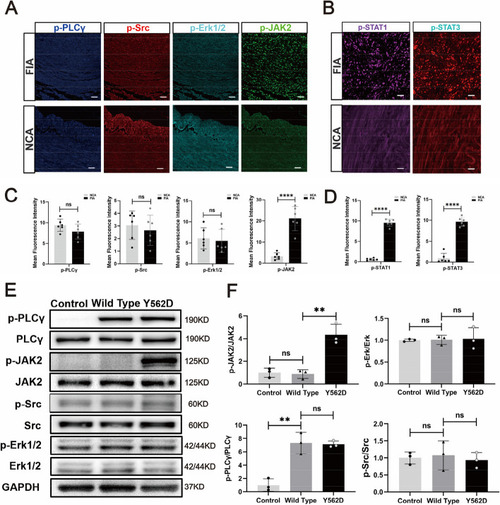
The JAK2-STAT pathway serves as the major downstream signaling pathway of the mutated PDGFB. mIF demonstrate the important downstream signaling pathway markers of PDGFRβ (p-JAK, p-Src, p-Erk1/2 and p-PLCγ) in FIA sections and NCA sections (A). Scale bar, 100 μm. Statistical analysis is performed to compare the mean fluorescence intensity of different signal markers between NCAs (n = 4) and FIAs (n = 5) (C). The expression of p-STAT1 and p-STAT3, which are downstream of p-JAK2, is detected by mIF in FIAs and NCAs. Scale bar, 50 μm (B). Statistical analysis of mean fluorescence intensity of these marks between NCAs (n = 4) and FIAs (n = 5) (D). Western blotting displays the expression of the important downstream signal pathway markers of PDGFRβ (p-JAK2, p-Src, p-Erk1/2 and p-PLCγ) in the HBVSMCs underwent different treatment in vitro (E). Relative density (normalized to Control) of immunoblot bands from (E) corresponding to pPLCγ, p-JAK2, p-Src, and p-ERK1/2 (n = 3) (F). 'n' represented the number of samples. Three random fields were selected for statistical analysis in each sample, and the average value represented the detection value of this marker in this sample. Tukey's multiple comparisons test is conducted to evaluate the statistical differences. ns, no significant; ***padj < 0.001, ****padj < 0.0001

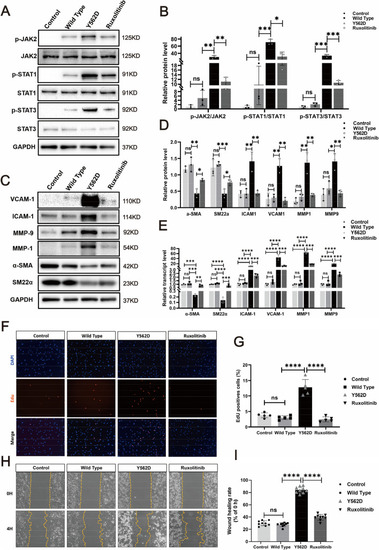
Ruxolitinib effectively reverse the PDGFRBY562D-induced phenotypic modulation in HBVSMCs. Western blotting illustrates the alterations in p-JAK2 and p-STAT (p-STAT1 and p-STAT3) expression across different treatment groups (A). After normalization to the control group, the relative density of immunoblot bands in (A) is presented in scatter bar graph (B). Immunoblots (C) and relative density of bands (D) of markers associated with phenotypic modulation in HBVSMCs under different treatments are shown. A bar graph is used to present the rt-qPCR results for smooth muscle cell (SMC) markers and inflammatory markers in HBVSMCs under different treatment conditions (E). The results of RT-qPCR are analyzed using Tukey's multiple comparisons test. EDU assay demonstrate the proliferative capacity of HBVSMCs receiving different treatments (F) and statistical analysis of the proportion of Edu-positive cells in the different groups from 5 different fields of each group at × 200 magnification. Statistical differences are detected using Tukey's multiple comparisons test (G). Scratch assay shows the proliferative capacity of HBVSMCs underwent different treatment (H) and statistical analysis of the rate of wound healing (reduced area at 4H /area at 0H) in the different groups from 5 different fields of each group at × 200 magnification. Statistical differences are detected using Tukey's multiple comparisons test (I). ns, no significant; *p < 0.05; **p < 0.01. The above experiments are all repeated three times

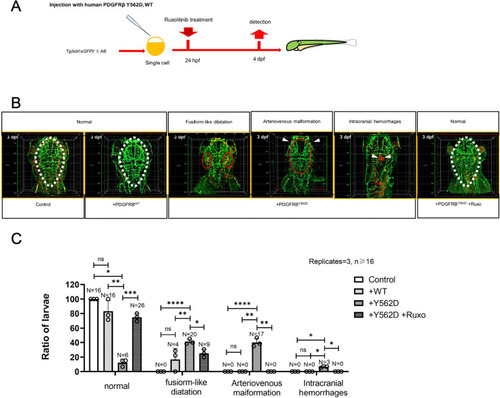
Ruxolitinib can reverse the phenotype caused by the PDGFRβ.Y562D in zebrafish. A The timeline of human WT/Y562D PDGFRβ mRNA treatment and medication administration: Embryos are injected human WT/Y562D PDGFRβ mRNA at one-cell stage and treated with Ruxolitinib at 24 h post-fertilization (24 hpf) and preserve at 3 days post-fertilization (3 dpf). B and C Immunostaining of kdrl:eGFP + cells and erythrocytes(αe1) in the head of a 3 dpf embryos treated or not with Ruxolitinib. Statistical significance is determined using Student's t-test and Benjamini–Hochberg correction. ns, no significant; *padj < 0.05, **padj < 0.01, ***padj < 0.001, ****padj < 0.0001

Acknowledgments
This image is the copyrighted work of the attributed author or publisher, and ZFIN has permission only to display this image to its users. Additional permissions should be obtained from the applicable author or publisher of the image. Full text @ J. Biomed. Sci.