
|
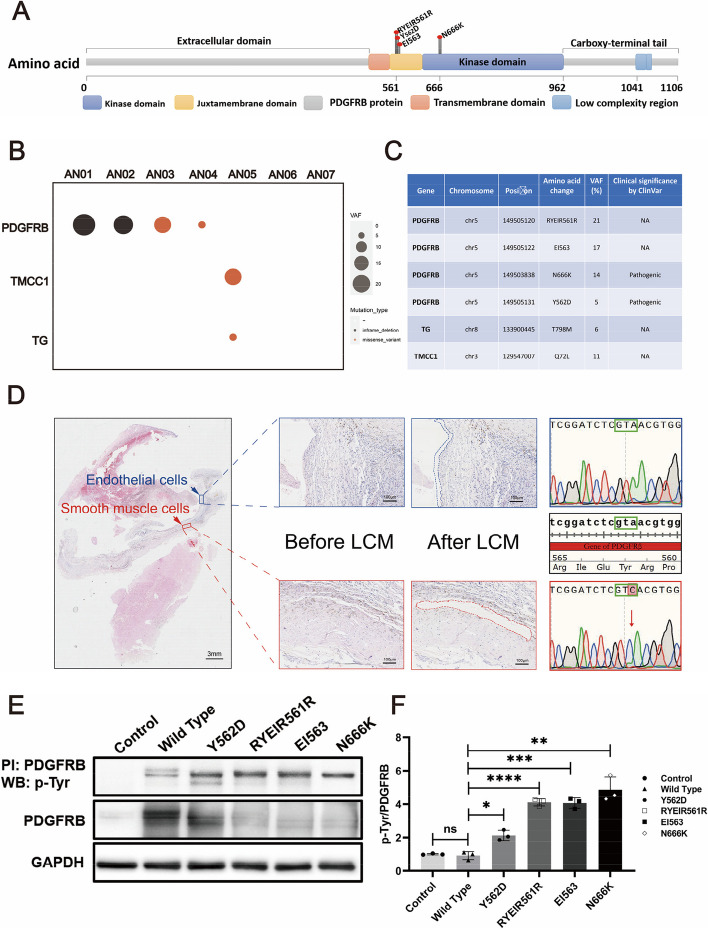
Fig. 2
Somatic mutational landscape of FIAs. Structure of the protein encoded by PDGFRβ and the lollipop plots illustrate the location of the identified mutations in our cohort. The color of the boxes denotes different regions of the encoded protein. The coordinates represent the n-th amino acids (