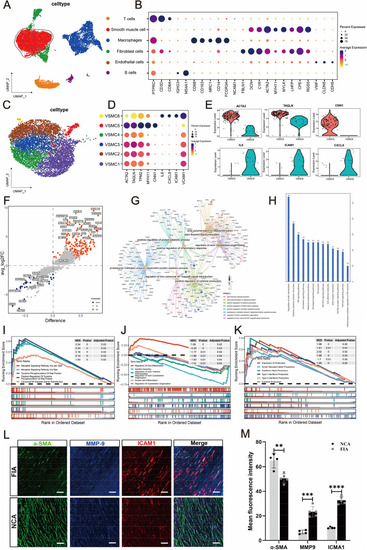
Single-cell transcriptional profiling of intracranial fusiform aneurysmal cells (A-K) and multi-color immunofluorescence (mIF) of smooth muscle cells (SMCs) markers and inflammatory markers between intracranial fusiform aneurysms (IFAs) and normal cerebral arteries (NCAs) (L-M). T-SNE visualization of intracranial fusiform aneurysmal cells type. Colored according to cell type (A). Visualization of specific gene expression patterns related to cell subsets identified in (A) using a bubble plot (B). T-SNE visualization of VSMC cell clusters. Colored according to clusters (C). Visualization of structural protein and inflammation-related genes expression patterns within the subsets of smooth muscle cells identified in (C) using a bubble plot (D). The violin plots show the expression differences of structural protein genes and inflammatory genes between the contraction subgroup (VSMC5) and the inflammatory subgroup (VSMC6) (E). The volcano plot specifically shows the gene expression differences between the two cell groups (F). The petal plot displays the GO enrichment analysis results of differential genes between the VSMC5 and VSMC6 (G). The bar graph shows the KEGG enrichment analysis results of differential genes between these two cell subsets (H). The GSEA enrichment analysis results of differential genes between the two groups. The enrichment results of differential genes related to signaling pathways (I). The enrichment results of differential genes related to structural protein genes (J). The enrichment results of differential genes related to the process of inflammatory factor secretion (K). α-SMA (green, SMCs marker), MMP-9 (blue, inflammatory marker) and ICAM-1 (red, inflammatory marker) in FIAs and NCAs are detected using mIF. Scale bar, 100 μm (L). Statistical analysis of mean fluorescence intensity about SMCs marker (α-SMA) and inflammatory markers (ICAM-1 and MMP-9) between NCAs (n = 4) and FIAs (n = 5). 'n' represented the number of samples. Three random fields were selected for statistical analysis in each sample, and the average value represented the detection value of this marker in this sample. The Student's t-test is utilized to examine the statistical differences among each marker. ns, no significant; **p < 0.01, ***p < 0.01 (M). n values indicate number of independent experiments performed
|
