IMAGE

Fig. 5

ID
ZDB-IMAGE-240515-38
Source
Figures for Hao et al., 2024
Image
Figure Caption

Fig. 5

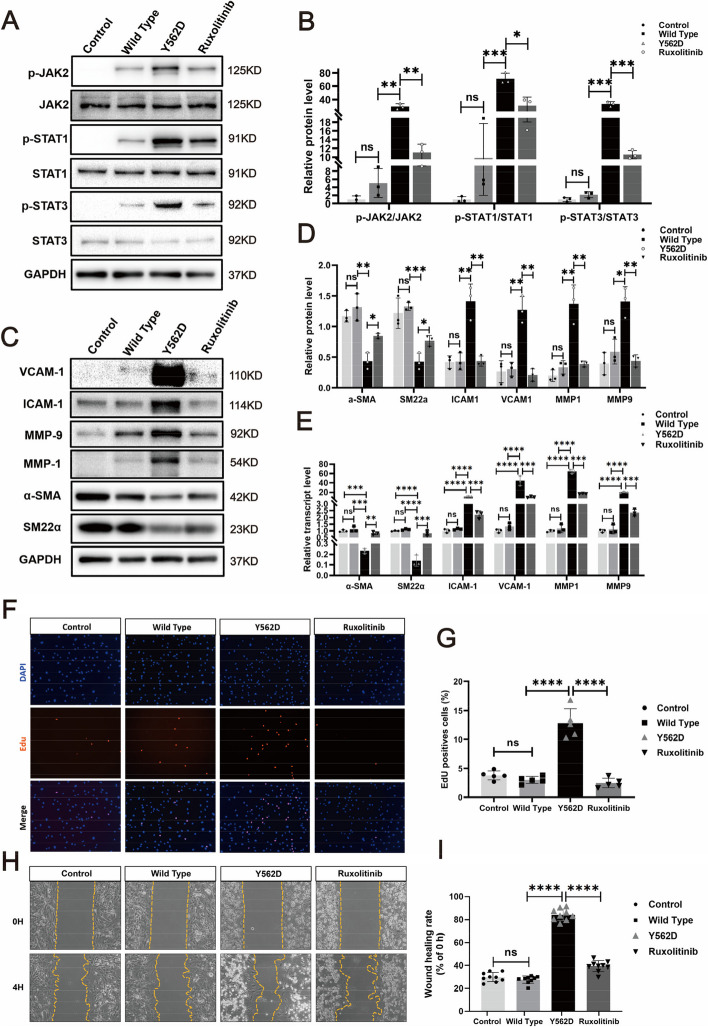
Ruxolitinib effectively reverse the PDGFRBY562D-induced phenotypic modulation in HBVSMCs. Western blotting illustrates the alterations in p-JAK2 and p-STAT (p-STAT1 and p-STAT3) expression across different treatment groups (A). After normalization to the control group, the relative density of immunoblot bands in (A) is presented in scatter bar graph (B). Immunoblots (C) and relative density of bands (D) of markers associated with phenotypic modulation in HBVSMCs under different treatments are shown. A bar graph is used to present the rt-qPCR results for smooth muscle cell (SMC) markers and inflammatory markers in HBVSMCs under different treatment conditions (E). The results of RT-qPCR are analyzed using Tukey's multiple comparisons test. EDU assay demonstrate the proliferative capacity of HBVSMCs receiving different treatments (F) and statistical analysis of the proportion of Edu-positive cells in the different groups from 5 different fields of each group at × 200 magnification. Statistical differences are detected using Tukey's multiple comparisons test (G). Scratch assay shows the proliferative capacity of HBVSMCs underwent different treatment (H) and statistical analysis of the rate of wound healing (reduced area at 4H /area at 0H) in the different groups from 5 different fields of each group at × 200 magnification. Statistical differences are detected using Tukey's multiple comparisons test (I). ns, no significant; *p < 0.05; **p < 0.01. The above experiments are all repeated three times

Acknowledgments
This image is the copyrighted work of the attributed author or publisher, and ZFIN has permission only to display this image to its users. Additional permissions should be obtained from the applicable author or publisher of the image. Full text @ J. Biomed. Sci.