FIGURE SUMMARY
Title

Genetic regulation of injury induced heterotopic ossification in adult zebrafish

Authors
Kaliya-Perumal, A.K., Celik, C., Carney, T.J., Harris, M.P., Ingham, P.W.
Source
Full text @ Dis. Model. Mech.

Heterotopic bone formation at the tail fin lepidotrichia. (A) Site of caudal peduncle contusion (boxed area). (B) Appearance of an uninjured tail fin under fluorescence microscopy in a transgenic Tg(sp7:gfp) zebrafish. The boxed area represents the site where heterotopic bone formation was noted, as shown in E-M. (C) Timeline representing the recurring injuries with a 48-h interval in between, followed by a 4-week wait to observe heterotopic bone. (D) Pie chart showing the overall number of fish with and without heterotopic bone (n=23). (E-I) Fluorescence microscopy of injured Tg(sp7:gfp) zebrafish. (J-M) Alizarin Red staining of injured wild-type zebrafish. Exuberant heterotopic bone formation (arrow in E) bridging multiple adjacent fin rays beneath the overlying soft tissues of the caudal peduncle and various other forms of heterotopic bone (arrows in F-M) were observed. Scale bars: 500 µm (B,E); 200 µm (F-M).

Hypertrophy of intermuscular bones following contusions. (A) Boxed areas represent the contusion sites. (B) Injury timeline, similar to that for pectoral fin injuries but resulting in hypertrophy of intermuscular (IM) bones. (C-F) Alizarin Red-stained caudal peduncle regions of wild-type fish. (G-J) Alizarin Red-stained thoracic regions of wild-type fish. Scale bars: 500 µm. (C,D) Uninjured caudal peduncle sites showing the intermuscular bones (arrows). Epineurals are dorsally located and epipleurals are ventrally located. (E) Injured caudal peduncle site, 1 month later, showing hypertrophied hypurals and parahypural (arrows). (F) Injury site showing hypertrophied intermuscular bones (arrows). (G) Uninjured thoracic region showing normal epineural intermuscular bones (arrows). The absence of epipleurals in the thoracic region can be noted. (H,I) Injured thoracic region, 1 month later, showing hypertrophied intermuscular bones (arrows). (J) Hypertrophied neural spines in an injured fish (arrows). (K) Comparison of intermuscular bone size between the uninjured and injured side (n=12 bones/group from four fish), with significantly larger intermuscular bones observed on the injured side (y-axis is in μm²). Boxes show the interquartile range, whiskers show the highest and lowest value, and the median is marked with a line. ***P<0.0001 (two-tailed unpaired t-test).

Consistent heterotopic ossification in the form of spurs and bridges in the pectoral fin. (A) Graphic depicting the injury site. (B) Medial view of an uninjured right pectoral fin stained with Alizarin Red. The yellow box indicates the injury site; the zoomed-in dotted box focuses on the articular region of a dissected fin ray, comprising the dorsal and ventral hemirays. (C) Lateral view of an uninjured pectoral fin of Tg(sp7:gfp; ctsk:dsred) fish under fluorescence microscopy. (D) The same fish as in C after elevating the pectoral fin to show the inner (medial) side where the absence of osteoclastic activity can be noted. (E,F) Medial and lateral views of an injured pectoral fin, 24 h post injury, showing tiny flecks of bone (stars) arising from the microfractures. (G) Lateral aspect of an injured pectoral fin of Tg(sp7:gfp; ctsk:dsred) fish showing osteoclastic activity (star) at 24 h post injury. (H) Osteoclastic activity on the medial aspect seen after elevating the fin (stars). (I) Injured pectoral fin, 1 month after injury. Arrows highlight the heterotopic bone spurs. (J) Heterotopic bridging bone noticed between the marginal ray and the second ray in one of the injured fish (arrows). (K-M) Different forms of heterotopic bone spurs encountered following injury (arrows). Images are representative of the first batch of five fish per condition. The observed heterotopic ossification phenotype was consistently reproducible in subsequent batches (n=32 fish). Scale bars: 200 µm (B,E,F,I-M); 500 µm (C,D,G,H).

RNA-sequencing cluster analysis and differential gene expression. (A) Graphic showing the caudal peduncle contusion site from where tissues were extracted. (B) Principal component analysis (PCA) plot displaying sample distances. Control, no injury; SI, 24 h after single injury; MI, 24 h after multiple injuries; D5MI, 5 days after multiple injuries. n=9 fish per condition; n=3 fish per biological replicate. (C,D) Venn diagrams illustrating the number of upregulated and downregulated genes in each comparison. (E-G) Volcano plots depicting the overall numbers of upregulated and downregulated genes among the three comparisons, with log2(fold change) on the x-axis and significance on the y-axis. (H) Heat map of selected genes of interest.

Differential expression of kcnk5b and higher magnitude of heterotopic bone formation in kcnk5bpfau/+ mutants. (A) Violin plot depicting the differential expression of kcnk5b as inferred from RNA sequencing. The y-axis represents log2(normalised count). Control, no injury; SI, 24 h after single injury; MI, 24 h after multiple injuries; D5MI, 5 days after multiple injuries. n=9 fish per condition; n=3 fish per biological replicate. (B) qRT-PCR validation of the differential expression of kcnk5b. n=9 fish per condition; n=3 fish per biological replicate. (C,D) Uninjured left and injured right pectoral fins of a kcnk5bpfau/+ mutant zebrafish visualised by Alizarin Red staining 2 weeks post injury. (D) Medial aspect of the injured pectoral fin showing extensive heterotopic ossification (boxed area). (E) Top view of the injured pectoral fin shown in D clearly illustrating the extent of heterotopic bone (arrow). (F,G) Uninjured left and injured right pectoral fins of a kcnk5bpfau/+ mutant zebrafish visualised 1 month post injury. (G) Medial aspect of the injured pectoral fin showing extensive heterotopic ossification (boxed area). (H) Top view of the injured pectoral fin shown in G indicating bridging (arrow) between the second fin ray and the radial bones. (I-L) 3D-reconstructed CT scans. (I,J) Medial view of the uninjured left and injured right pectoral fins of a wild-type fish. (J) Injured pectoral fin showing heterotopic bone spurs highlighted in colour. (K,L) Medial view of the uninjured left and injured right pectoral fins of a kcnk5bpfau/+ mutant fish. (L) Injured pectoral fin showing extensive heterotopic bone (highlighted in colour), unlike that of wild-type fish. (M) Box and whisker plot showing the comparison of bone volume differences at 4 weeks post injury (n=5 fish per group). The blue box represents the difference between bone volume of uninjured (control) and injured wild-type fins, expressed as percentages. The orange box represents the same for kcnk5bpfau/+ mutants. Note the significant positive difference in kcnk5bpfau/+ mutants. Boxes show the interquartile range, whiskers show the highest and lowest value, and the median is marked with a line. NS, not significant; *P<0.05; ***P<0.001 (Wilcoxon rank-sum test with Benjamini-Hochberg correction in A; two-tailed unpaired t-test in B, M). Scale bars: 200 µm (C-H).

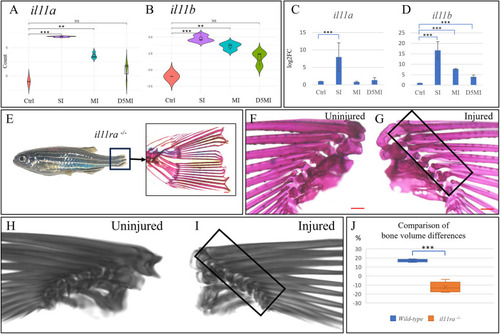
Differential expression of genes encoding Il-11, and absent heterotopic ossification in il11ra−/− mutants. (A,B) Violin plots depicting the differential expression of il11a and il11b as per RNA sequencing. The y-axis represents log2(normalised count). Control, no injury; SI, 24 h after single injury; MI, 24 h after multiple injuries; D5MI, 5 days after multiple injuries. n=9 fish per condition; n=3 fish per biological replicate. (C,D) qRT-PCR validation of the differential expression of il11a and il11b. n=9 fish per condition; n=3 fish per biological replicate. (E) il11ra−/− mutant zebrafish demonstrating impaired tail fin regeneration (boxed area) at 2 weeks following injury. The zoomed-in image shows an Alizarin Red-stained section of a non-regenerated tail fin. (F,G) Uninjured left and injured right pectoral fins of an il11ra−/− mutant zebrafish visualised 1 month post injury. (G) Medial view of the injured right pectoral fin showing no signs of heterotopic bone. (H,I) Three-dimensional reconstructed computed tomography scans. (I) Medial view of the injured right pectoral fin showing no heterotopic bone. (J) Box and whisker plot showing the comparison of bone volume differences (n=5 fish per group). The blue box represents the difference between bone volume of uninjured (control) and injured wild-type fins, expressed as percentages. The orange box represents the same for il11ra−/− mutants. Note the significant negative difference in il11ra−/− mutants. Boxes show the interquartile range, whiskers show the highest and lowest value, and the median is marked with a line. NS, not significant; **P<0.01; ***P<0.001 (Wilcoxon rank-sum test with Benjamini-Hochberg correction in A,B; two-tailed unpaired t-test in C,D,J). Scale bars: 200 µm (E-G).

Analysis of thoracic intermuscular bone size following injury in kcnk5bpfau/+ and il11ra−/− mutants. (A) Representative images comparing the thoracic intermuscular bones on the uninjured and injured sides in kcnk5bpfau/+ (n=24 bones/side from five fish) and its wild-type (WT) sibling controls (n=18 bones/side from five fish), as well as in il11ra−/− (n=14 bones/side from four fish) and its WT sibling controls (n=14 bones/side from four fish). Scale bars: 200 µm. (B) Quantitative analysis revealed that the difference in size between uninjured and injured fins was more pronounced in the kcnk5bpfau/+ mutants compared to that in their wild-type siblings. In contrast, the difference was minimal in il11ra−/− mutants. Data show the mean±s.d. *P<0.05; **P<0.01; ***P<0.001 (two-tailed unpaired t-test for parametric data comparison; Mann-Whitney U test for non-parametric data comparison).

Acknowledgments
This image is the copyrighted work of the attributed author or publisher, and ZFIN has permission only to display this image to its users. Additional permissions should be obtained from the applicable author or publisher of the image. Full text @ Dis. Model. Mech.