
Fig. 2.
- ID
- ZDB-IMAGE-240606-32
- Publication
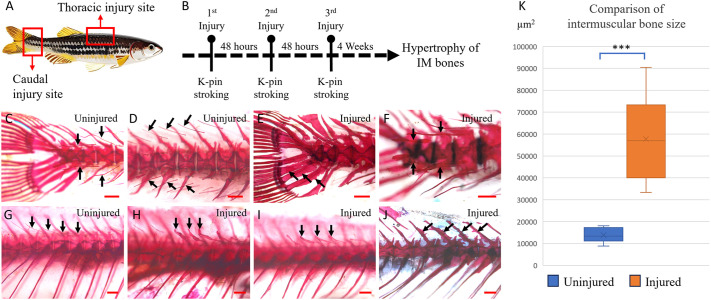
- Kaliya-Perumal et al., 2024 - Genetic regulation of injury induced heterotopic ossification in adult zebrafish
- All Figures
- Figures for Kaliya-Perumal et al., 2024
|
Fig. 2.