|
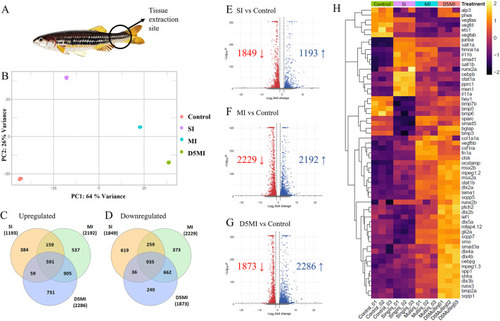
RNA-sequencing cluster analysis and differential gene expression. (A) Graphic showing the caudal peduncle contusion site from where tissues were extracted. (B) Principal component analysis (PCA) plot displaying sample distances. Control, no injury; SI, 24 h after single injury; MI, 24 h after multiple injuries; D5MI, 5 days after multiple injuries. n=9 fish per condition; n=3 fish per biological replicate. (C,D) Venn diagrams illustrating the number of upregulated and downregulated genes in each comparison. (E-G) Volcano plots depicting the overall numbers of upregulated and downregulated genes among the three comparisons, with log2(fold change) on the x-axis and significance on the y-axis. (H) Heat map of selected genes of interest.
|