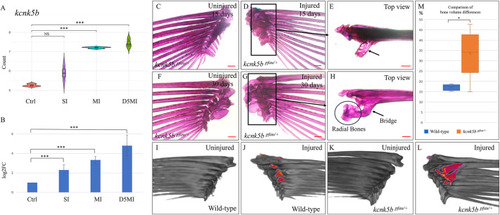
Differential expression of kcnk5b and higher magnitude of heterotopic bone formation in kcnk5bpfau/+ mutants. (A) Violin plot depicting the differential expression of kcnk5b as inferred from RNA sequencing. The y-axis represents log2(normalised count). Control, no injury; SI, 24 h after single injury; MI, 24 h after multiple injuries; D5MI, 5 days after multiple injuries. n=9 fish per condition; n=3 fish per biological replicate. (B) qRT-PCR validation of the differential expression of kcnk5b. n=9 fish per condition; n=3 fish per biological replicate. (C,D) Uninjured left and injured right pectoral fins of a kcnk5bpfau/+ mutant zebrafish visualised by Alizarin Red staining 2 weeks post injury. (D) Medial aspect of the injured pectoral fin showing extensive heterotopic ossification (boxed area). (E) Top view of the injured pectoral fin shown in D clearly illustrating the extent of heterotopic bone (arrow). (F,G) Uninjured left and injured right pectoral fins of a kcnk5bpfau/+ mutant zebrafish visualised 1 month post injury. (G) Medial aspect of the injured pectoral fin showing extensive heterotopic ossification (boxed area). (H) Top view of the injured pectoral fin shown in G indicating bridging (arrow) between the second fin ray and the radial bones. (I-L) 3D-reconstructed CT scans. (I,J) Medial view of the uninjured left and injured right pectoral fins of a wild-type fish. (J) Injured pectoral fin showing heterotopic bone spurs highlighted in colour. (K,L) Medial view of the uninjured left and injured right pectoral fins of a kcnk5bpfau/+ mutant fish. (L) Injured pectoral fin showing extensive heterotopic bone (highlighted in colour), unlike that of wild-type fish. (M) Box and whisker plot showing the comparison of bone volume differences at 4 weeks post injury (n=5 fish per group). The blue box represents the difference between bone volume of uninjured (control) and injured wild-type fins, expressed as percentages. The orange box represents the same for kcnk5bpfau/+ mutants. Note the significant positive difference in kcnk5bpfau/+ mutants. Boxes show the interquartile range, whiskers show the highest and lowest value, and the median is marked with a line. NS, not significant; *P<0.05; ***P<0.001 (Wilcoxon rank-sum test with Benjamini-Hochberg correction in A; two-tailed unpaired t-test in B, M). Scale bars: 200 µm (C-H).
|
