
- Title
-
FLT4 causes developmental disorders of the cardiovascular and lymphovascular systems via pleiotropic molecular mechanisms
- Authors
- Monaghan, R.M., Naylor, R.W., Flatman, D., Kasher, P.R., Williams, S.G., Keavney, B.D.
- Source
- Full text @ Cardiovasc. Res.

Schematic representation of FLT4/VEGFR3 protein. Red bracket: location of missense or in frame indels identified in TOF. Black bracket: location of inframe MD variants. Blue bracket: location of TOF-PTVs (P30fs*3 to Y1337fs*19). The eight variants experimentally studied here are indicated. SRP, signal recognition peptide; IgDs, immunoglobulin-like domains. |
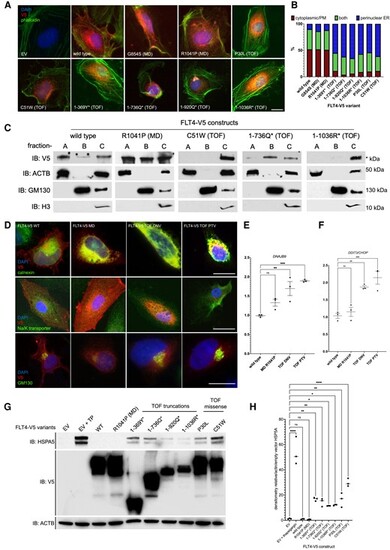
Subcellular localization and proteostatic signalling consequences of FLT4 TOF variants. (A) HUVECs expressing WT, MD, and TOF FLT4-V5 variants, stained with anti-V5 (red, FLT4), phalloidin (green, actin filaments), and DAPI (blue, nuclear stain). Scale bar, 10 μm. (B) Cells scored for three types of V5 staining, perinuclear/ER, PM/cytoplasmic, or both. One hundred cells in each group scored in each of three biological repeats. (C) Subcellular fractionation followed by immunoblotting for COS7 cells expressing FLT4 WT, MD, TOF-DNV, or two TOF-PTV variants. Fractions: A—PM, cytoplasmic; B—vesicular/Golgi apparatus-associated; or C—nuclear/perinuclear, ER. Markers: ACTB, cytoplasmic or nucleoplasmic cytoskeletal; GM130, Golgi apparatus; H3, histone 3, nuclear marker. V5-C-terminally tagged FLT4 variants. (D) Colocalization of FLT4-V5 tagged proteins with markers of the ER: calnexin; PM, Na/K-transporter; GM130, Golgi apparatus. (E and F) The activation of gene expression of proteostatic signalling by FLT4-TOF-DNV and FLT4-TOF-PTV variants. n = 3; **P < 0.01; ***P < 0.001. (G) Activation of proteostatic signalling in HEK293T cells measured through HSP5A protein expression assessed by immunoblot. (H) Densiometric analysis of HSP5A bands relative to actin/EV from (C). n = 3, *P < 0.05; **P < 0.01, ****P < 0.001; one-way ANOVA compared with EV. |
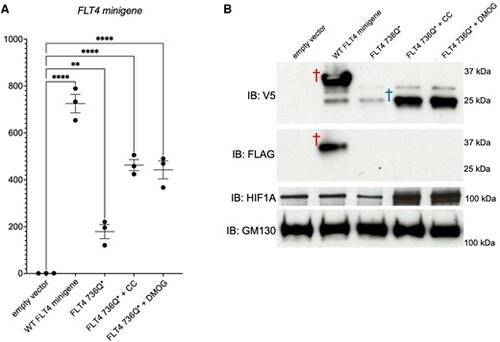
Hypoxia mimetics regulate the stability of an FLT4/ FLT4-TOF-PTV. RNA (A) or protein (B) was prepared from primary human ECs (HUVECs) expressing the FLT4 minigene assay construct (as outlined in Supplementary material online, Figure S4). EV, WT, or Q736* PTV FLT4 minigenes were untreated, or treated with the hypoxia mimetics, 0.2 mM cobalt chloride (CC) or 100 nM DMOG, for 3 h. Red dagger, full-length minigene protein, both V5 and FLAG positive; blue dagger, truncated minigene protein caused by the introduction of a nonsense codon and concomitant C-terminal cleavage, V5 positive only; n = 3; **P < 0.01; ****P < 0.0001. |
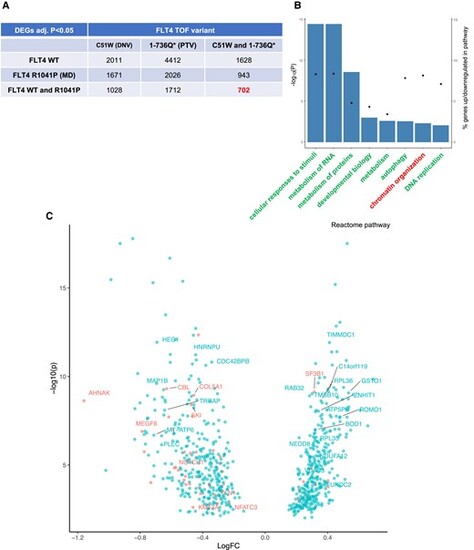
Distinct transcriptomic profiles of primary human ECs expressing both types of TOF variants compared with WT or an MD FLT4. (A) Distribution of DEGs between HUVECs expressing FLT4-V5 WT, FLT4 R1041P (MD), and FLT4 TOF-DNV (C51W) or FLT4-TOF-PTV (1-736Q*), identified by RNAseq. (B) Reactome analysis of the 702 TOF FLT4-specific DEGs, up- or down-regulated examined separately, displaying pathways identified with FDR < 0.01. (C) Volcano plot showing the 702 FLT4 TOF-specific DEGs, with genes taken forward for qPCR analysis labelled, and those previously associated with CHD in red. |
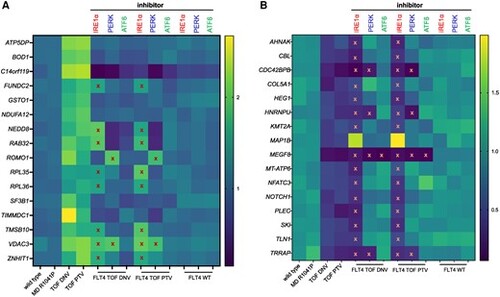
Rescue of FLT4 TOF-specific DEGs, represented as a heat map of gene expression levels, both (A) up-regulated and (B) down-regulated, by inhibitors of the three major proteostatic signalling pathways. Heat map of RNA levels (yellow highest, dark blue lowest) from HUVECs expressing WT FLT4-V5, MD, TOF-DNV, or TOF-PTV variants; the latter two treated with specific inhibitors of the three main proteostatic signalling pathways, or WT treated with the same inhibitors, above, IRE1α (red), PERK (blue), or ATF6 (green). Row names, gene targets. Red crosses represent no significant rescue (P still <0.05 compared with WT) and orange crosses represent DEGs whose expression changes not recused by drug treatment (P < 0.05 compared to WT still) of the gene expression changes induced by FLT4 TOF variant expression compared with WT. |
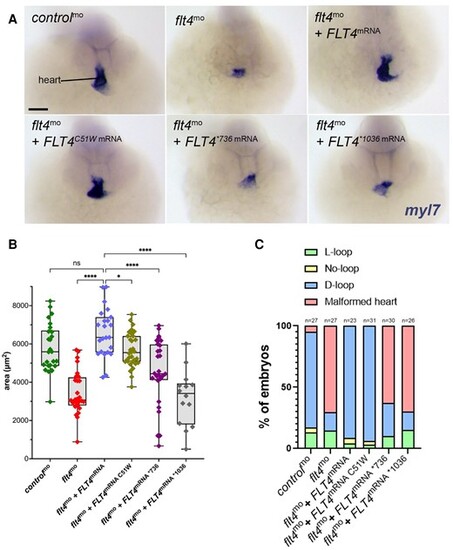
Rescue of zebrafish morphant cardiac phenotypes by FLT4 variants. (A) Frontal views of 48 hpf embryos with myl7 expression staining (purple) used to label the heart. (B) Box and whisker plot showing the area of embryonic hearts 48 hpf, taken from the co-injected flt4 MO and FLT4 variant mRNA samples. One-way ANOVA comparing all samples to the flt4-depleted MO sample rescued by co-injection of human FLT4 expressing mRNA; *P < 0.05; ****P < 0.0001. (C) Histogram showing the percentage of embryos with d-loop, no loop/reduced heart size, or l-loop heart orientations. |

ZFIN is incorporating published figure images and captions as part of an ongoing project. Figures from some publications have not yet been curated, or are not available for display because of copyright restrictions. |