
Fig. 2
- ID
- ZDB-FIG-240904-7
- Publication
- Monaghan et al., 2024 - FLT4 causes developmental disorders of the cardiovascular and lymphovascular systems via pleiotropic molecular mechanisms
- Other Figures
- All Figure Page
- Back to All Figure Page
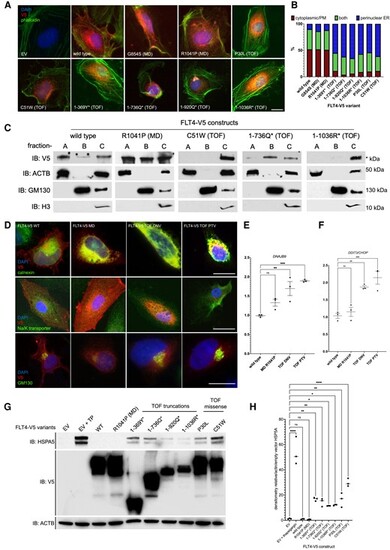
Subcellular localization and proteostatic signalling consequences of FLT4 TOF variants. (A) HUVECs expressing WT, MD, and TOF FLT4-V5 variants, stained with anti-V5 (red, FLT4), phalloidin (green, actin filaments), and DAPI (blue, nuclear stain). Scale bar, 10 μm. (B) Cells scored for three types of V5 staining, perinuclear/ER, PM/cytoplasmic, or both. One hundred cells in each group scored in each of three biological repeats. (C) Subcellular fractionation followed by immunoblotting for COS7 cells expressing FLT4 WT, MD, TOF-DNV, or two TOF-PTV variants. Fractions: A—PM, cytoplasmic; B—vesicular/Golgi apparatus-associated; or C—nuclear/perinuclear, ER. Markers: ACTB, cytoplasmic or nucleoplasmic cytoskeletal; GM130, Golgi apparatus; H3, histone 3, nuclear marker. V5-C-terminally tagged FLT4 variants. (D) Colocalization of FLT4-V5 tagged proteins with markers of the ER: calnexin; PM, Na/K-transporter; GM130, Golgi apparatus. (E and F) The activation of gene expression of proteostatic signalling by FLT4-TOF-DNV and FLT4-TOF-PTV variants. n = 3; **P < 0.01; ***P < 0.001. (G) Activation of proteostatic signalling in HEK293T cells measured through HSP5A protein expression assessed by immunoblot. (H) Densiometric analysis of HSP5A bands relative to actin/EV from (C). n = 3, *P < 0.05; **P < 0.01, ****P < 0.001; one-way ANOVA compared with EV. |