
Fig. 5
- ID
- ZDB-FIG-240904-10
- Publication
- Monaghan et al., 2024 - FLT4 causes developmental disorders of the cardiovascular and lymphovascular systems via pleiotropic molecular mechanisms
- Other Figures
- All Figure Page
- Back to All Figure Page
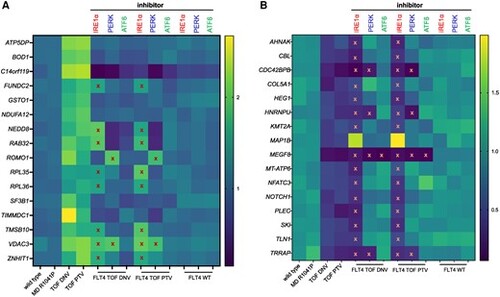
Rescue of FLT4 TOF-specific DEGs, represented as a heat map of gene expression levels, both (A) up-regulated and (B) down-regulated, by inhibitors of the three major proteostatic signalling pathways. Heat map of RNA levels (yellow highest, dark blue lowest) from HUVECs expressing WT FLT4-V5, MD, TOF-DNV, or TOF-PTV variants; the latter two treated with specific inhibitors of the three main proteostatic signalling pathways, or WT treated with the same inhibitors, above, IRE1α (red), PERK (blue), or ATF6 (green). Row names, gene targets. Red crosses represent no significant rescue (P still <0.05 compared with WT) and orange crosses represent DEGs whose expression changes not recused by drug treatment (P < 0.05 compared to WT still) of the gene expression changes induced by FLT4 TOF variant expression compared with WT. |