
- Title
-
BMP7 promotes cardiomyocyte regeneration in zebrafish and adult mice
- Authors
- Bongiovanni, C., Bueno-Levy, H., Posadas Pena, D., Del Bono, I., Miano, C., Boriati, S., Da Pra, S., Sacchi, F., Redaelli, S., Bergen, M., Romaniello, D., Pontis, F., Tassinari, R., Kellerer, L., Petraroia, I., Mazzeschi, M., Lauriola, M., Ventura, C., Heermann, S., Weidinger, G., Tzahor, E., D'Uva, G.
- Source
- Full text @ Cell Rep.
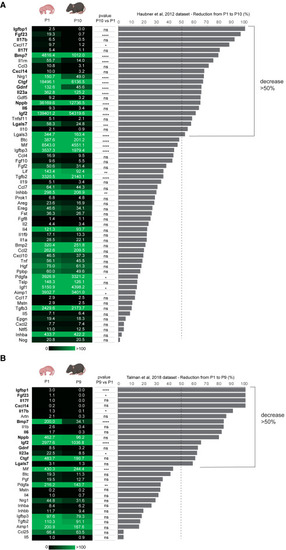
Identification of growth factors with declining expression levels during early cardiac postnatal development (A and B) mRNA expression levels of growth factors in mouse postnatal day 1 (P1, first column) and postnatal day 9 or 10 (P9 or P10, second column) heart lysates obtained by meta-analysis of RNA-sequencing data,16,44 along with the calculated decrease from P1 to P10 (or P9) in terms of percentage (graph bar). The values in the first and second columns are presented as mean expression levels of three biological replicates; the p value is reported for the reduction from P1 to P10 (or P9) (third column) as follows ∗p ≤ 0.05; ∗∗p ≤ 0.01; ∗∗∗p ≤ 0.001; ∗∗∗∗p ≤ 0.0001. |
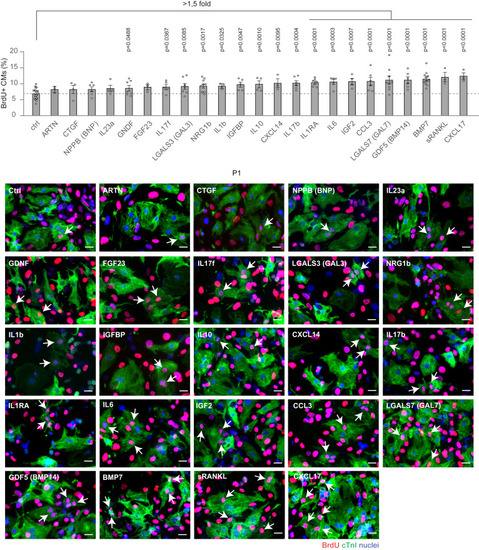
Ability of candidate growth factors to induce neonatal cardiomyocyte cell-cycle progression Cardiomyocytes isolated from neonatal mice were cultured in vitro and stimulated for 48 h with selected growth factors (10 ng/mL), namely ARTN, CTGF, NPPB (BNP), IL23a, GDNF, FGF23, IL17f, LGALS3 (GAL3), NRG1b, IL1b, IGFBP, IL10, CXCL14, IL17b, IL1RA, IL6, IGF2, CCL3, GDF5 (BMP14), LGALS7 (GAL7), BMP7, sRANKL, and CXCL17. Cardiomyocytes were identified by cardiac Troponin I (cTnI) staining and analyzed by immunofluorescence for DNA synthesis (BrdU incorporation assay) (n = 34,914 cardiomyocytes pooled from the analysis of 162 samples); representative pictures are provided; arrows point at proliferating cardiomyocytes; scale bars, 20 μm. The values are presented as mean (error bars show SEM), statistical significance was determined using one-way ANOVA followed by Sidak’s test by comparing pairs of treatments (control vs. selected growth factor). |
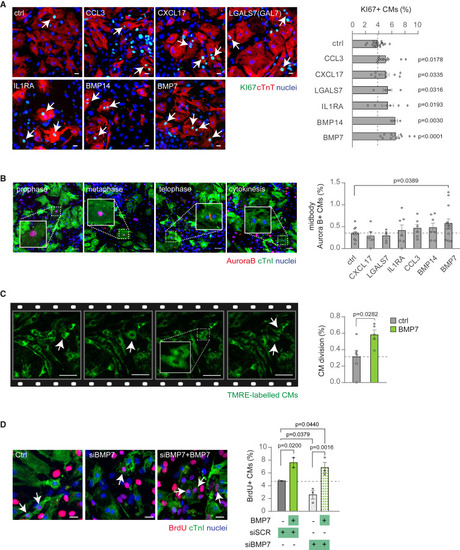
BMP7 robustly induces cell cycle activity and cell division in neonatal mammalian cardiomyocytes (A and B) Cardiomyocytes isolated from postnatal day 1 (P1) mice were cultured in vitro and stimulated for 48 h with selected growth factors (10 ng/mL), namely CCL3, CXCL17, GAL7 (LSGAL7), IL1RA, BMP14, and BMP7. Cardiomyocytes were identified by cardiac Troponin T (cTnT) or Troponin I (cTnI) staining and analyzed by immunofluorescence for (A) cell-cycle activity (KI67) or (B) cytokinesis (midbody Aurora B kinase) (n = 13,961 cardiomyocytes pooled from the analysis of 68 samples in A; n = 57,498 cardiomyocytes pooled from the analysis of 55 samples in B); representative pictures are provided; arrows point at proliferating cardiomyocytes; scale bars, 20 μm in (A) and 50 μm in (B). (C) Quantification and representative images of cell division events (n = 11 samples with a total of 5184 cardiomyocytes analyzed) in TMRE-labeled neonatal cardiomyocytes detected in 16-h time-lapse imaging at 15-min intervals in vitro; arrows point at cardiomyocytes undergoing cell division; scale bars, 50 μm. (D) Evaluation of neonatal (postnatal day 1, P1) cardiomyocyte proliferation by immunofluorescence analysis of DNA synthesis (BrdU assay) following knockdown of BMP7 and stimulation with/without BMP7 (10 ng/mL) for 48 h (n = 2,480 cardiomyocytes pooled from the analysis of 11 samples). Representative pictures are provided; scale bars, 20 μm; arrows point at cycling cardiomyocytes. The values are presented as mean (error bars show SEM), statistical significance was determined using one-way ANOVA followed by Sidak’s test in (A), (B), and (D) (comparison between pairs of treatments; control vs. selected growth factor) and two-sided Student’s t test in (C). |

Bmp7 loss- and gain-of-function respectively reduces and increases cardiomyocyte proliferation during zebrafish heart regeneration (A) Experimental design for the analysis of cardiomyocyte cell cycling in bmp7a homozygous mutant fish at 7 days post cryoinjury (dpi). (B) Immunofluorescence analysis of EdU incorporation and MHC (to identify cardiomyocytes) on cryoinjured hearts of bmp7a mutant fish and wild-type siblings. n (wild-type) = 7 hearts, three sections per heart, 1158 cardiomyocytes, n (bmp7a−/−) = 6 hearts, three sections per heart, 472 cardiomyocytes. Representative pictures are provided; arrows point at cycling cardiomyocytes; scale bars, 100 μm. (C) Experimental design depicting the use of a transgenic line allowing for heat-shock-inducible overexpression of bmp7b together with constitutive expression of GFP in cardiomyocytes. (D) Immunofluorescence analysis of PCNA (proliferating cell nuclear antigen) and myosin light chain 7 (MYL7, to identify cardiomyocytes) in heat-shocked hsp70L:bmp7b, myl7:eGFPaf5Tg transgenic and wild-type siblings at 7 dpi. Note that GFP fluorescence is not shown. n (wild-type) = 12 hearts, two sections per heart, 421 cardiomyocytes. n (hsp70L:bmp7b, myl7:eGFP) = 9 hearts, two sections per heart, 472 cardiomyocytes. EdU- and PCNA-positive cardiomyocytes in (B) and (D), respectively, were counted manually within the border zone of control and transgenic fishes. Each dot represents a different heart (biological replicate), which is the average of the analysis of two to three sections. Representative pictures are provided; arrows point at cycling cardiomyocytes; scale bars, 50 μm. The values in (B) and (D) are presented as mean, error bars show SEM, statistical significance was determined using two-sided Student’s t test. |
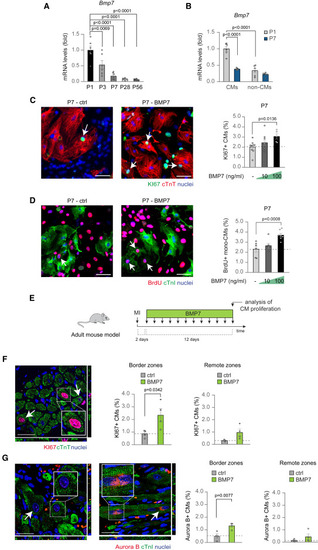
BMP7 administration stimulates the proliferation of mammalian cardiomyocytes at juvenile stage and in adult life following myocardial infarction (A) Bmp7 mRNA expression levels in heart lysates from postnatal day 1 (P1), 3 (P3), 7 (P7), 28 (P28), and 56 (P56) mice (n = 6 hearts per developmental stage) as determined by qRT-PCR and shown relative to the level at P1. (B) Bmp7 mRNA expression levels in cardiomyocytes and stromal cells isolated from postnatal day 1 (P1) and postnatal day 7 (P7) hearts and separated by immunomagnetic separation (n = 10 samples for cardiomyocytes and 12 for stromal cells). (C and D) Immunofluorescence analysis of (C) KI67 and cardiac Troponin T (cTnT) or (D) BrdU incorporation and cardiac Troponin I (cTnI) in postnatal day 7 (P7) total or mononucleated cardiomyocytes following stimulation with BMP7 at 10 and 100 ng/mL for 48 h (for KI67/cTnT staining a total of 5,553 cardiomyocytes pooled from 23 samples have been analyzed; for BrdU/cTnI staining a total of 2843 cardiomyocytes pooled from 19 samples have been analyzed); representative pictures are provided; arrows point at cycling cardiomyocytes; scale bars, 50 μm. (E) Experimental design for the analysis of cardiac regeneration following ligation of the left anterior descending coronary artery in adult mice (3 months old). (F and G) In vivo evaluation of adult cardiomyocyte proliferation by immunofluorescence analysis of (F) KI67 and cardiac Troponin T (cTnT) or (G) Aurora B kinase and cardiac Troponin I (cTnI) in the border and remote zones of heart sections 14 days post myocardial infarction, following daily injection of BMP7 or water as control (n = 8 mice; for KI67/cTnT staining a total of 14,345 cardiomyocytes have been analyzed in the border zones and 23,085 cardiomyocytes in the remote zones; for Aurora B/cTnI staining a total of 10,088 cardiomyocytes have been analyzed in the border zones and 14,242 cardiomyocytes in the remote zones). Each dot represents a different heart (biological replicate), which is the average of the analysis of two to three sections. Representative pictures show images taken by confocal microscopy showing the xy maximum intensity projection of the stacks acquired from the sample (the slices view on the bottom and left of each panel represent the xz and yz stacks, respectively); arrows point at proliferating cardiomyocytes; scale bars, 25 μm. The values in (A), (B), (C), (D), (F), and (G) are presented as mean (error bars show SEM); statistical significance was determined using one-way ANOVA followed by Sidak’s test in (A), (B), (C), and (D) (comparison between pairs of treatments; control vs. BMP7) or using two-sided Student’s t test in (F) and (G). |
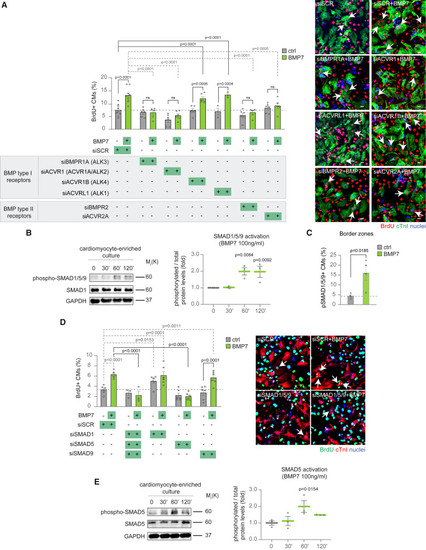
BMP7 induces cardiomyocyte proliferation through BMPR1A/ACVR1 and ACVR2/BMPR2 receptors and canonical SMAD5 signaling (A) Evaluation of the role of BMP receptors in BMP7-induced cardiomyocyte proliferation by immunofluorescence analysis of DNA synthesis (BrdU assay) in neonatal (postnatal day 1, P1) cardiomyocytes following BMPR1A, ACVR1, ACVR1B, ACVRL1, BMPR2, and ACVR2A knockdown, upon BMP7 stimulation at 10 ng/mL for 48 h (n = 23,895 cardiomyocytes pooled from the analysis of 83 samples); representative pictures are provided; scale bars, 20 μm, arrows point at proliferating cardiomyocytes. (B) Western blot analysis of phospho-SMAD1/5/9, SMAD1, and GAPDH protein levels in enriched neonatal cardiomyocytes, separated from stromal cells by immunomagnetic separation, following BMP7 stimulation at 100 ng/mL for 30, 60, and 120 min (n = 3 replicates per condition). GAPDH protein levels are provided as second loading control (see also Figures S10A). (C) Immunofluorescence analysis for phospho-SMAD1/5/9 and cardiac Troponin T (cTnT) in the border zones of heart sections 14 days post myocardial infarction, following daily injection of BMP7 or water as control (n = 8 mice; a total of 8,342 cardiomyocytes have been analyzed). Phospho-SMAD1/5/9 positive cardiomyocytes in tissue sections were counted within border zones; every dot represents a different heart (biological replicate), which in turn has been calculated as average of the analysis of one to two sections. (D) Immunofluorescence analysis of DNA synthesis (BrdU assay) and cardiac Troponin I (cTnI) on neonatal (postnatal day 1, P1) cardiomyocytes following SMAD1, SMAD5, and SMAD9 knockdown, alone or in combination, upon BMP7 stimulation at 10 ng/mL for about 48 h (n = 19,167 cardiomyocytes pooled from the analysis of 54 samples); representative pictures are provided; scale bars, 20 μm, arrows point at proliferating cardiomyocytes. (E) Western blot analysis of phospho-SMAD5, SMAD5, and GAPDH protein levels in enriched neonatal (postnatal day 1, P1) cardiomyocytes, separated from stromal cells by immunomagnetic separation, following BMP7 stimulation at 100 ng/mL for 30, 60, and 120 min (n = 3 replicates per condition). GAPDH protein levels are provided as second loading control (see also Figures S10D). The values in (A)–(E) are presented as mean (error bars show SEM); statistical significance was determined using one-way ANOVA followed by Sidak’s test (comparison between pairs of treatments) in (A), (B), (D), and (E); and using two-sided Student’s t test in (C). |
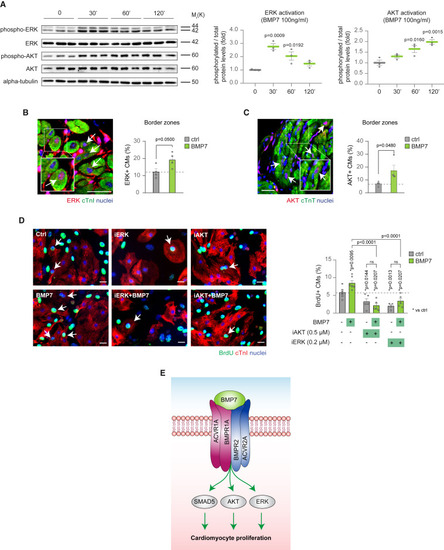
ERK and AKT non-canonical pathways take part in BMP7 mitogenic signal transduction (A) Western blot analysis of protein levels of phospho-ERK, ERK, phospho-AKT, AKT, and alpha-tubulin in neonatal (postnatal day 1, P1) cardiac cultures following stimulation with 100 ng/mL BMP7 for 30, 60, and 120 min (n = 3 replicates per condition). Alpha-tubulin protein levels are provided as second loading control. (B and C) Immunofluorescence analysis for (B) ERK and cardiac Troponin I (cTnI) or (C) AKT and cardiac Troponin T (cTnT) in the border zones of heart sections 14 days post myocardial infarction, following daily injection of BMP7 or water as control (n = 8 mice; a total of 9,318 and 4,652 cardiomyocytes have been analyzed in B and C, respectively). Cardiomyocytes with nuclear ERK or AKT immunoreactivity were counted manually within border zones in tissue sections; every dot represents a different heart (biological replicate), which in turn has been calculated by the analysis of one to two sections. Representative pictures are provided; arrows point at ERK-positive cardiomyocytes in (B) and at AKT-positive cardiomyocytes in (C); scale bars, 20 μm. (D) Quantification of BrdU incorporation in neonatal (postnatal day 1, P1) cardiomyocytes upon treatment with inhibitors of AKT (Akt inhibitor VIII 0.5 μM) or ERK (PD0325901 0.2 μM), with or without administration of BMP7 at 10 ng/mL for 48 h (n = 8204 cardiomyocytes pooled from the analysis of 31 samples); cardiomyocytes were identified by cardiac Troponin I (cTnI) immunostaining. Representative pictures are provided; arrows point at proliferating cardiomyocytes; scale bars, 20 μm. (E) BMP7 signal transduction model triggering cardiomyocyte proliferation, showing the involvement of canonical SMAD5 and non-canonical ERK and AKT. The values in (A)–(D) are presented as mean (error bars show SEM), statistical significance was determined using one-way ANOVA followed by Sidak’s test in (A) and (D) (comparison between pairs of treatments), and using two-sided Student’s t test in (B) and (C). |
|