
|
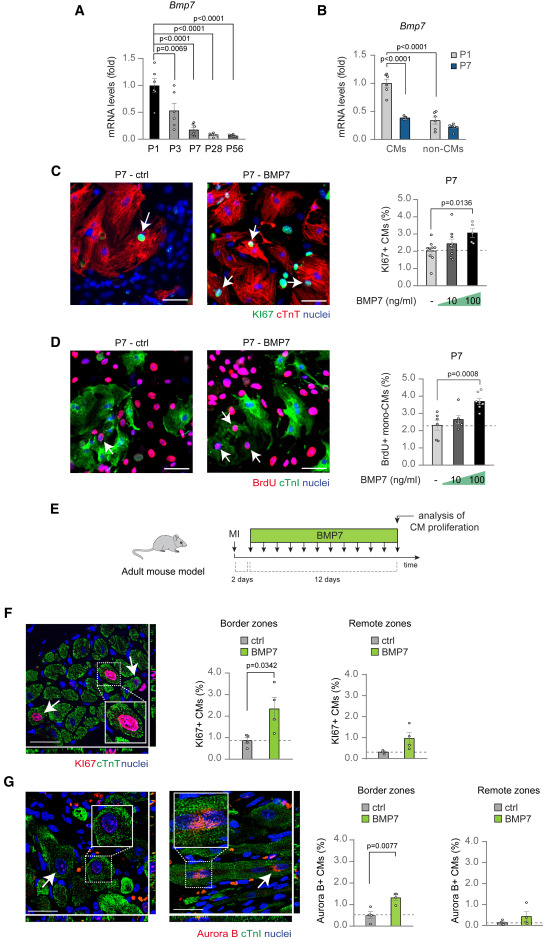
Fig. 5 BMP7 administration stimulates the proliferation of mammalian cardiomyocytes at juvenile stage and in adult life following myocardial infarction (A) Bmp7 mRNA expression levels in heart lysates from postnatal day 1 (P1), 3 (P3), 7 (P7), 28 (P28), and 56 (P56) mice (n = 6 hearts per developmental stage) as determined by qRT-PCR and shown relative to the level at P1. (B) Bmp7 mRNA expression levels in cardiomyocytes and stromal cells isolated from postnatal day 1 (P1) and postnatal day 7 (P7) hearts and separated by immunomagnetic separation (n = 10 samples for cardiomyocytes and 12 for stromal cells). (C and D) Immunofluorescence analysis of (C) KI67 and cardiac Troponin T (cTnT) or (D) BrdU incorporation and cardiac Troponin I (cTnI) in postnatal day 7 (P7) total or mononucleated cardiomyocytes following stimulation with BMP7 at 10 and 100 ng/mL for 48 h (for KI67/cTnT staining a total of 5,553 cardiomyocytes pooled from 23 samples have been analyzed; for BrdU/cTnI staining a total of 2843 cardiomyocytes pooled from 19 samples have been analyzed); representative pictures are provided; arrows point at cycling cardiomyocytes; scale bars, 50 μm. (E) Experimental design for the analysis of cardiac regeneration following ligation of the left anterior descending coronary artery in adult mice (3 months old). (F and G) In vivo evaluation of adult cardiomyocyte proliferation by immunofluorescence analysis of (F) KI67 and cardiac Troponin T (cTnT) or (G) Aurora B kinase and cardiac Troponin I (cTnI) in the border and remote zones of heart sections 14 days post myocardial infarction, following daily injection of BMP7 or water as control (n = 8 mice; for KI67/cTnT staining a total of 14,345 cardiomyocytes have been analyzed in the border zones and 23,085 cardiomyocytes in the remote zones; for Aurora B/cTnI staining a total of 10,088 cardiomyocytes have been analyzed in the border zones and 14,242 cardiomyocytes in the remote zones). Each dot represents a different heart (biological replicate), which is the average of the analysis of two to three sections. Representative pictures show images taken by confocal microscopy showing the xy maximum intensity projection of the stacks acquired from the sample (the slices view on the bottom and left of each panel represent the xz and yz stacks, respectively); arrows point at proliferating cardiomyocytes; scale bars, 25 μm. The values in (A), (B), (C), (D), (F), and (G) are presented as mean (error bars show SEM); statistical significance was determined using one-way ANOVA followed by Sidak’s test in (A), (B), (C), and (D) (comparison between pairs of treatments; control vs. BMP7) or using two-sided Student’s t test in (F) and (G).