
Fig. 6
- ID
- ZDB-FIG-240620-69
- Publication
- Bongiovanni et al., 2024 - BMP7 promotes cardiomyocyte regeneration in zebrafish and adult mice
- Other Figures
- All Figure Page
- Back to All Figure Page
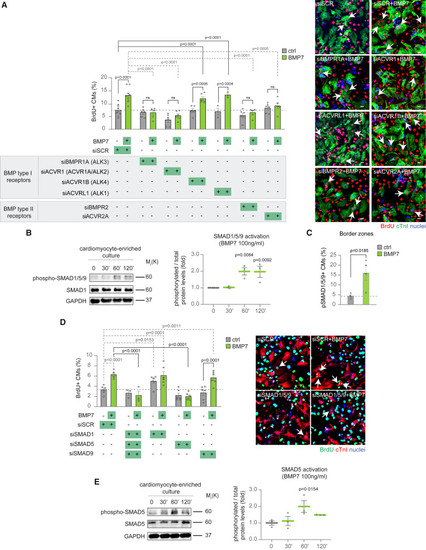
BMP7 induces cardiomyocyte proliferation through BMPR1A/ACVR1 and ACVR2/BMPR2 receptors and canonical SMAD5 signaling (A) Evaluation of the role of BMP receptors in BMP7-induced cardiomyocyte proliferation by immunofluorescence analysis of DNA synthesis (BrdU assay) in neonatal (postnatal day 1, P1) cardiomyocytes following BMPR1A, ACVR1, ACVR1B, ACVRL1, BMPR2, and ACVR2A knockdown, upon BMP7 stimulation at 10 ng/mL for 48 h (n = 23,895 cardiomyocytes pooled from the analysis of 83 samples); representative pictures are provided; scale bars, 20 μm, arrows point at proliferating cardiomyocytes. (B) Western blot analysis of phospho-SMAD1/5/9, SMAD1, and GAPDH protein levels in enriched neonatal cardiomyocytes, separated from stromal cells by immunomagnetic separation, following BMP7 stimulation at 100 ng/mL for 30, 60, and 120 min (n = 3 replicates per condition). GAPDH protein levels are provided as second loading control (see also Figures S10A). (C) Immunofluorescence analysis for phospho-SMAD1/5/9 and cardiac Troponin T (cTnT) in the border zones of heart sections 14 days post myocardial infarction, following daily injection of BMP7 or water as control (n = 8 mice; a total of 8,342 cardiomyocytes have been analyzed). Phospho-SMAD1/5/9 positive cardiomyocytes in tissue sections were counted within border zones; every dot represents a different heart (biological replicate), which in turn has been calculated as average of the analysis of one to two sections. (D) Immunofluorescence analysis of DNA synthesis (BrdU assay) and cardiac Troponin I (cTnI) on neonatal (postnatal day 1, P1) cardiomyocytes following SMAD1, SMAD5, and SMAD9 knockdown, alone or in combination, upon BMP7 stimulation at 10 ng/mL for about 48 h (n = 19,167 cardiomyocytes pooled from the analysis of 54 samples); representative pictures are provided; scale bars, 20 μm, arrows point at proliferating cardiomyocytes. (E) Western blot analysis of phospho-SMAD5, SMAD5, and GAPDH protein levels in enriched neonatal (postnatal day 1, P1) cardiomyocytes, separated from stromal cells by immunomagnetic separation, following BMP7 stimulation at 100 ng/mL for 30, 60, and 120 min (n = 3 replicates per condition). GAPDH protein levels are provided as second loading control (see also Figures S10D). The values in (A)–(E) are presented as mean (error bars show SEM); statistical significance was determined using one-way ANOVA followed by Sidak’s test (comparison between pairs of treatments) in (A), (B), (D), and (E); and using two-sided Student’s t test in (C). |