
Fig. 7
- ID
- ZDB-FIG-240620-71
- Publication
- Bongiovanni et al., 2024 - BMP7 promotes cardiomyocyte regeneration in zebrafish and adult mice
- Other Figures
- All Figure Page
- Back to All Figure Page
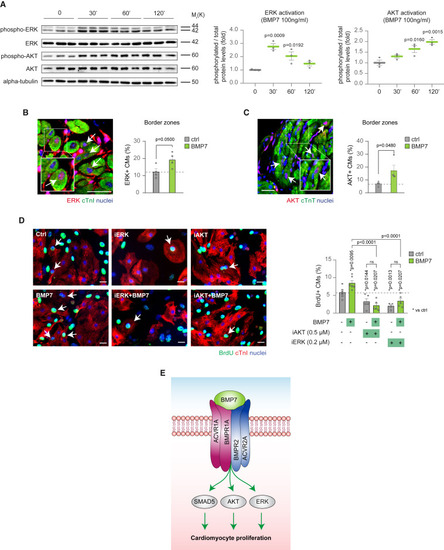
ERK and AKT non-canonical pathways take part in BMP7 mitogenic signal transduction (A) Western blot analysis of protein levels of phospho-ERK, ERK, phospho-AKT, AKT, and alpha-tubulin in neonatal (postnatal day 1, P1) cardiac cultures following stimulation with 100 ng/mL BMP7 for 30, 60, and 120 min (n = 3 replicates per condition). Alpha-tubulin protein levels are provided as second loading control. (B and C) Immunofluorescence analysis for (B) ERK and cardiac Troponin I (cTnI) or (C) AKT and cardiac Troponin T (cTnT) in the border zones of heart sections 14 days post myocardial infarction, following daily injection of BMP7 or water as control (n = 8 mice; a total of 9,318 and 4,652 cardiomyocytes have been analyzed in B and C, respectively). Cardiomyocytes with nuclear ERK or AKT immunoreactivity were counted manually within border zones in tissue sections; every dot represents a different heart (biological replicate), which in turn has been calculated by the analysis of one to two sections. Representative pictures are provided; arrows point at ERK-positive cardiomyocytes in (B) and at AKT-positive cardiomyocytes in (C); scale bars, 20 μm. (D) Quantification of BrdU incorporation in neonatal (postnatal day 1, P1) cardiomyocytes upon treatment with inhibitors of AKT (Akt inhibitor VIII 0.5 μM) or ERK (PD0325901 0.2 μM), with or without administration of BMP7 at 10 ng/mL for 48 h (n = 8204 cardiomyocytes pooled from the analysis of 31 samples); cardiomyocytes were identified by cardiac Troponin I (cTnI) immunostaining. Representative pictures are provided; arrows point at proliferating cardiomyocytes; scale bars, 20 μm. (E) BMP7 signal transduction model triggering cardiomyocyte proliferation, showing the involvement of canonical SMAD5 and non-canonical ERK and AKT. The values in (A)–(D) are presented as mean (error bars show SEM), statistical significance was determined using one-way ANOVA followed by Sidak’s test in (A) and (D) (comparison between pairs of treatments), and using two-sided Student’s t test in (B) and (C). |