
|
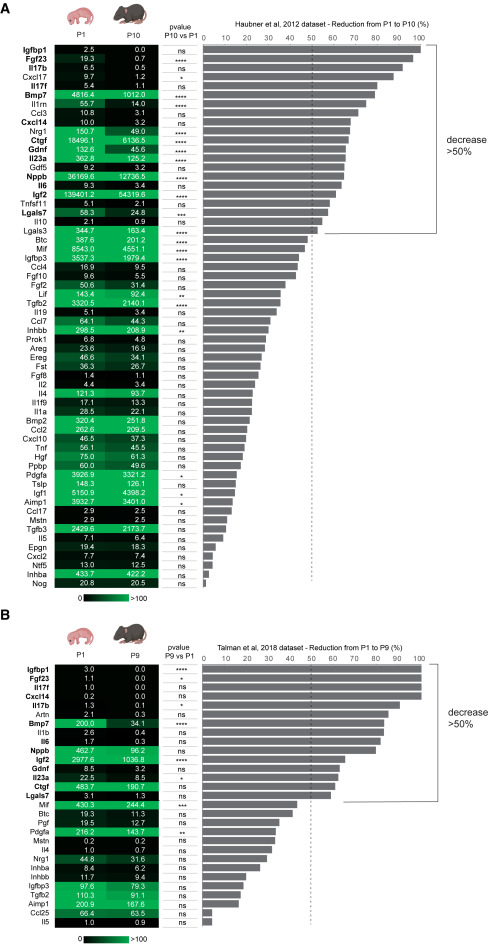
Fig. 1 Identification of growth factors with declining expression levels during early cardiac postnatal development (A and B) mRNA expression levels of growth factors in mouse postnatal day 1 (P1, first column) and postnatal day 9 or 10 (P9 or P10, second column) heart lysates obtained by meta-analysis of RNA-sequencing data,16,44 along with the calculated decrease from P1 to P10 (or P9) in terms of percentage (graph bar). The values in the first and second columns are presented as mean expression levels of three biological replicates; the p value is reported for the reduction from P1 to P10 (or P9) (third column) as follows ∗p ≤ 0.05; ∗∗p ≤ 0.01; ∗∗∗p ≤ 0.001; ∗∗∗∗p ≤ 0.0001.