
- Title
-
Label-free, whole-brain in vivo mapping in an adult vertebrate with third harmonic generation microscopy
- Authors
- Akbari, N., Tatarsky, R.L., Kolkman, K.E., Fetcho, J.R., Xu, C., Bass, A.H.
- Source
- Full text @ J. Comp. Neurol.
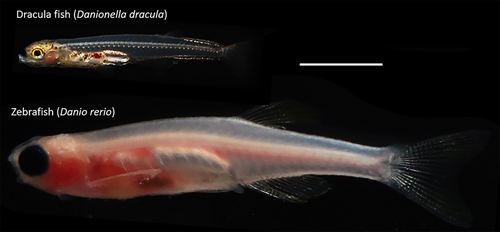
Comparison of adult Danionella dracula and zebrafish, Danio rerio. Shown here are a male D. dracula and a male from the Casper line of zebrafish. Note the hypertrophied lower jaw of D. dracula. Scale bar indicates 5 mm. |
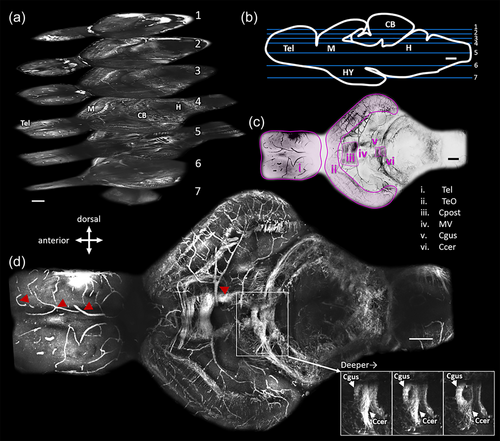
Representative images obtained by third harmonic generation microscopy through the entire depth of the brain of an adult Danionella dracula. Whole-brain images were obtained by stitching together stacks from five field of views (see Section 2). (a) Three-dimensional distribution of structures at seven horizontal levels within the brain. Compass indicates brain direction for (a–d). Images were collected with a pixel size of 0.53 μm. Scale bar indicates 100 μm in the xy plane. Numbers on each plane represent the depth inside the brain as depicted in panel (b). (b) Horizontal planes in part (a) are labeled at their approximate depth on sagittal line drawing of the brain with blue lines. Labels on line drawing indicate telencephalon (Tel), midbrain (M), cerebellum (CB), hindbrain (H), and hypothalamus (HY). Scale bar indicates 100 μm. (c) Identification of prominent myelinated fiber bundles of image in (d). Image is the same as panel (d) and presented in inverted color scale for clarity. Tel: telencephalon, TeO: Optic tectum, Cpost: posterior commissure, MV: midbrain ventricle, Ccer: Cerebellar commissure, Cgus: gustatory commissure. Scale bar indicates 100 μm. (d) Maximum projection of all the frames that contain Cpost. Red arrowheads indicate blood vessels. Panel on the bottom left shows progressively deeper (left to right) individual frames from the stack going through the Ccer and Cgus. Scale bar indicates 100 μm. |
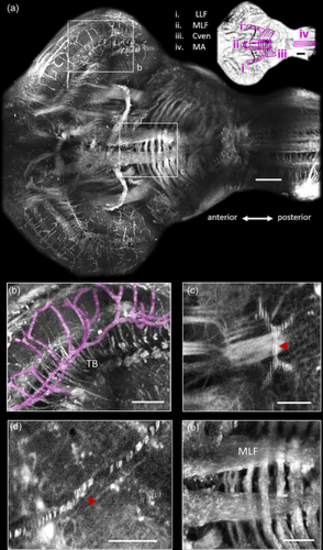
Identification of major fiber bundles and vasculature with third harmonic generation microscopy in the adult brain of Danionella dracula. (a) Maximum projection of all the frames that contain the medial longitudinal fasciculus (MLF). Anterior-posterior axis is indicated. Color-inverted image is presented in top right corner with major fiber bundles outlined in magenta (see adjacent legend). Scale bar indicates 100 μm for both images. LLF: lateral longitudinal fasciculus; Cven: ventral commissure; MA: Mauthner axon. (b) Region of optic tectum (TeO) outlined in (a). This image contains blood vessels (false colored with magenta) as well as individual axon fascicles that form the tectobulbar fiber bundles (TB). (c) Example of fast flowing red blood cells (RBCs) in blood vessel (red arrowhead). (d) Example of slow flowing RBCs in blood vessel (red arrowhead). This image is an average of several images, each containing a single red blood cell, leading to each cell being distinctly visible. (e) Higher magnification view of MLF and Cven in hindbrain outlined in (a). Scale bars indicate 50 μm for (b–e). Images collected with a pixel size of 0.53 μm (a, b, e) and 0.26 μm (c, d). |
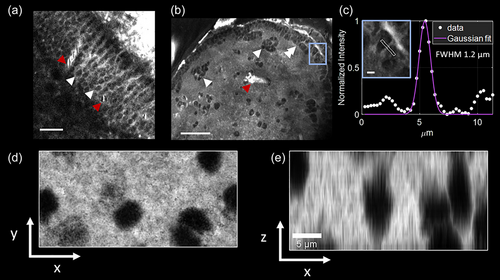
Visualizing individual cells with third harmonic generation (THG) microscopy in the adult brain of Danionella dracula. (a) Representative high magnification image from midbrain roof (optic tectum) showing closely packed cells (white arrowheads) and blood vessels (red arrowheads) within the periventricular gray zone. Scale bar indicates 20 μm. (b) Representative high magnification image from the pallium (area dorsalis of the telencephalon) showing layer of closely packed neurons along the outer ventricular margin (double white arrowheads) as well as individual neurons and clusters of closely packed neurons located more deeply (single white arrowheads); blood vessel is also indicated (red arrowhead). The anterior is toward top of the image. Scale bar indicates 50 μm. (c) Line profile of the area outlined in blue box in (b). A 5-pixel wide line is drawn on a small structure. The full width at half maximum (FWHM) of the profile is 1.2 μm, indicating that the technique can distinguish micrometer range features. Lateral (d) and axial (e) views of cell shadows in telencephalon obtained by THG microscopy. Images are minimum projection of column containing several cells acquired at 1 μm steps in z direction. Images collected with a pixel size of 0.26 μm (a, b, c) and 0.07 μm (d, e). |
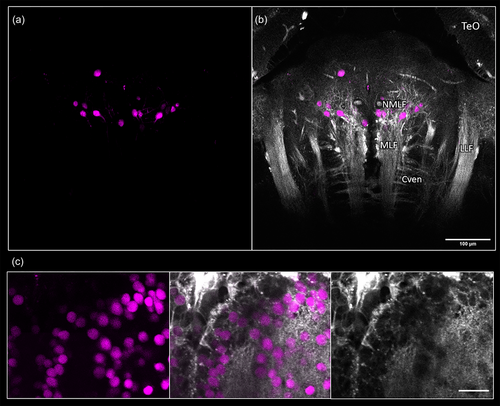
Demonstration of third harmonic generation (THG) microscopy as a navigation guide for in vivo fluorescence imaging. Anterior is to the top in all images. (a) Horizontal view of retrogradely labeled cells in the hindbrain of adult Danionella dracula following bulk injection of fluorescein into the spinal cord. (b) Overlay of THG microscopy with fluorescence image in (a). The lateral longitudinal fasciculus (LLF), medial longitudinal fasciculus (MLF), and axonal bundles of the ventral commissure (Cven) are clearly distinguishable in this image, providing landmarks for identification of the nucleus of the MLF (NMLF). TeO: optic tectum. (c) Nuclear-localized GCaMP-labeled neurons in Casper line of adult zebrafish were simultaneously visualized via three-photon excitation (3PE) and THG in the telencephalon of adult zebrafish, Danio rerio (left column: 3PE, middle column: overlay of 3PE and THG, right column: THG). Depending on the focal depth, the THG image corresponding to the fluorescently labeled neuron might appear faint for some cells. All images collected with a pixel size of 0.26 μm. |
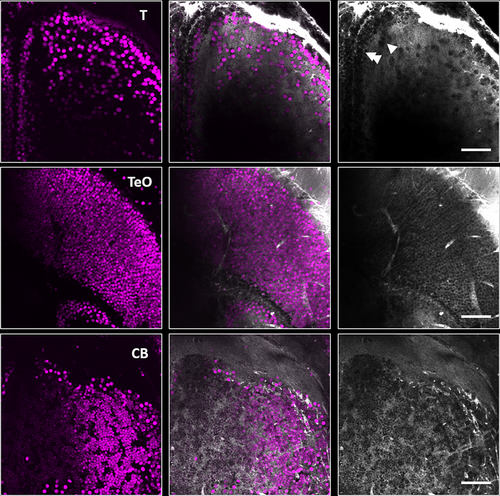
Visualization of cells with third harmonic generation (THG) microscopy in Casper line of adult zebrafish, Danio rerio. Nuclear-localized GCaMP-labeled neurons were simultaneously visualized via three-photon excitation (3PE) and THG in the telencephalon (T), optic tectum (TeO), and granule cell layer of the cerebellum (CB) (left column: 3PE, middle column: overlay of 3PE and THG, right column: THG). Closely packed cells along the outer ventricular margin of the telencephalon (top right) are pointed to by double white arrowheads and islands of closely packed cells located in area dorsalis are pointed out by single white arrowheads. All images collected with a pixel size of 0.26 μm. |
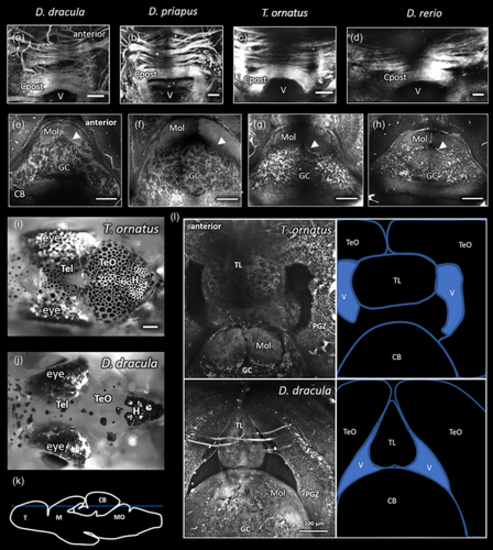
Comparisons of third harmonic generation images of Danionella dracula to D. priapus, Trochilocharax ornatus, and Danio rerio. (a–d) Posterior commissure (Cpost) in left to right, respectively, D. dracula, D. priapus, T. ornatus, and D. rerio (anterior is indicated in a for a–d). Images are a maximum projection in the horizontal plane of all frames containing Cpost. Scale bars indicate 50 μm. (e–h). Single horizontal plane images of cerebellum (CB) in left to right, respectively, D. dracula, D. priapus, T. ornatus, and D. rerio (anterior is indicated in e for e–h). Arrowhead indicates boundary of the molecular (Mol) and granule cell (GC) layers of the cerebellum as determined by cell shadows (arrowheads also point towards cell shadows). Scale bars indicate 100 μm. (i, j) Horizontal bright field images of surface views of T. ornatus (i) and D. dracula (j) brains. Scale bar in (i) indicates 250 μm for both images. (k) Sagittal line drawing depicting with blue line the approximate depth of the planes of view imaged in (l). (l) Horizontal view of caudal midbrain (top of image) and rostral hindbrain (bottom of image) of T. ornatus and D. dracula. Labels on the line drawings to the right indicate optic tectum (TeO), torus longitudinalis (TL), ventricle (V), and cerebellum (CB). Tightly packed cell layers of periventricular gray zone (PGZ) in the TeO and the granule cell (GC) and molecular (Mol) layers of the CB are distinctly identifiable in both images. Multiphoton images collected with pixel size of 0.53 μm (a, c), 1.05 μm (b, d, f), 0.26 μm (e, g, l), and 0.42 μm (h). |