FIGURE SUMMARY
Title

HERC5 downregulation in non-small cell lung cancer is associated with altered energy metabolism and metastasis

Authors
Schneegans, S., Löptien, J., Mojzisch, A., Loreth, D., Kretz, O., Raschdorf, C., Hanssen, A., Gocke, A., Siebels, B., Gunasekaran, K., Ding, Y., Oliveira-Ferrer, L., Brylka, L., Schinke, T., Schlüter, H., Paatero, I., Voß, H., Werner, S., Pantel, K., Wikman, H.
Source
Full text @ J. Exp. Clin. Cancer Res.

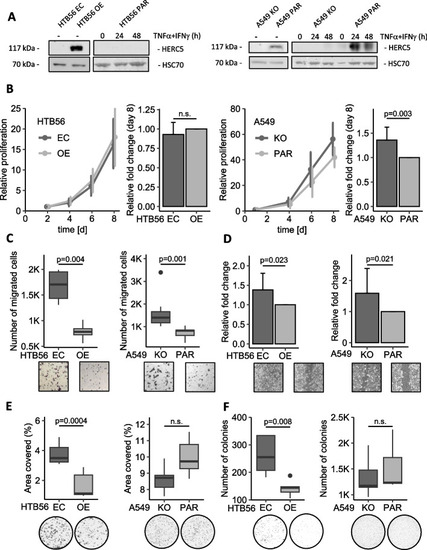
HERC5 inhibits tumor-associated aggressiveness in vitro. A Western Blot showing the HERC5 protein levels in the HTB56 OE/EC and A549 PAR/KO model cell lines with and without stimulation. B HTB56 EC/OE showed no significant differences in proliferation as assessed by a Methylene Blue proliferation assay (p = 0.438, n = 6, one sample t-test), while A549 KO/PAR cells showed a significant increase in proliferation at low HERC5 levels (p = 0.003, n = 11, one sample t-test). C HTB56 EC and A549 KO cells have an increased migratory potential compared to HTB56 OE (p = 0.004, n = 4, Student’s t-test) and A549 PAR cells (p = 0.001, n = 7, Mann–Whitney U test), respectively. D The wound healing assay revealed a higher ratio of migration toward the scratch in HTB56 EC compared to HERC5 OE (p = 0.023, n = 4, one sample t-test) and A549 HERC5 KO compared to PAR cells (p = 0.021, n = 3, one sample t-test) after 18 h. E and F Overexpression of HERC5 caused a decrease in clonogenic and anchorage-independent growth (p = 0.0004, n = 5, Student’s t-test; p = 0.008, n = 5, Student’s t-test, respectively) but not in A549 cells (p = 0.069, Student’s t-test, n = 5; p = 0.515, Student’s t-test, n = 5, respectively). Error bars in bar plots are depicting the 95% confidence interval

HERC5 KO promotes the survival of DTCs in a zebrafish model. A Representative images of zebrafish embryos. The black arrows indicate the fluorescently labeled A549 cells. B The number of A549 HERC5 KO cells compared to parental cells per zebrafish embryo is significantly increased in the whole body as well as separately in the brain and the body at 3 days post injection (whole body: p = 0.001; brain: p = 0.049; body: p = 0.001; n = 22; Mann–Whitney U Test)

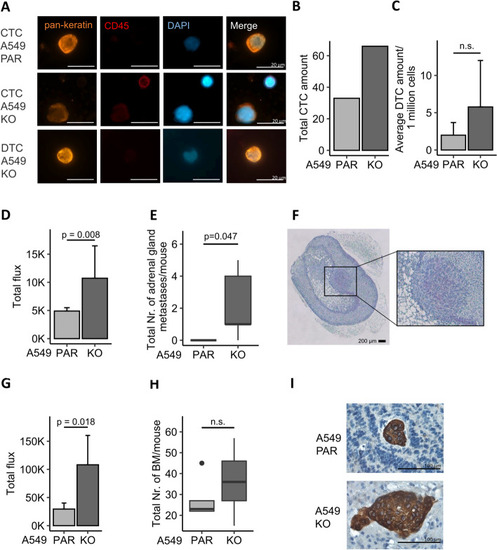
HERC5 inhibits tumor-associated aggressiveness in a mouse model.A Representative images of CTCs and DTCs detected in murine blood after intracardial injection of 500,000 A549 PAR-LUC and HERC5 KO-LUC cells. Tumor cells were enriched by a size-based enrichment technique and identified by pankeratin positivity, while CD45 was used as an exclusion marker. B Total CTC counts in pooled blood from 5 mice from the A549 PAR and HERC5 KO cohorts show an increase in CTCs in those mice injected with A549 HERC5 KO cells. C Average DTC amount per 1 million cells is elevated in HERC5 KO cells, however not significantly (n = 5). D and E Adrenal gland metastases were found only in the A549 HERC5 KO cohort; thus, the total number and volume per mouse were significantly increased compared to A549 PAR cohort (p = 0.047; n = 5; Mann–Whitney U test, respectively). F Representative image of adrenal gland metastases identified using HE staining. G and H The total number and volume of brain metastases per mouse were slightly higher in the A549 KO cohort; however, these differences were not significant (n = 5). I Representative image of brain metastases identified using pankeratin IHC staining and hematoxylin counterstaining. Error bars in bar plots are depicting the standard deviation

Proteomics reveals enrichment of proteins connected to mitochondrial metabolism in cell lines differentially expressing HERC5. A Venn diagram depicting differentially regulated proteins analyzed by mass spectrometry (n = 3). Four proteins were found dysregulated in both HTB56 and A549 cell line, with three of them upregulated in cells with high HERC5 expression. B Volcano plots depicting differentially expressed proteins (FC > 1.5, p value < 0.05, n = 3). Significantly downregulated proteins in HTB56 OE and A549 PAR cells are shown in blue, while upregulated proteins are presented in orange. C GO term enrichment analysis showing the top five significantly enriched proteins (using R package [37], n = 3) D Visualization of proteins involved in these GO terms for biological processes by using R package GOplot [38]

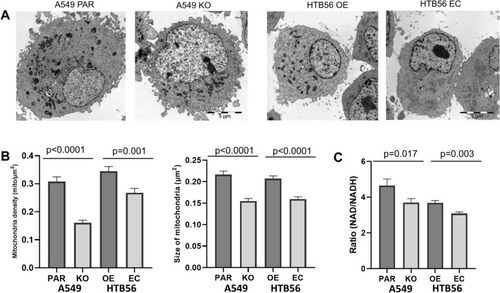
HERC5 induces changes in mitochondrial morphology. A Representative electron microscopy images of A549 PAR/KO and HTB56 OE/EC cells. B Mitochondrial density and size increase in cells with high HERC5 expression (density: HTB56 EC/OE: p = 0.001; A549 KO/PAR: p < 0.0001; n = 30; size: HTB56 EC/OE: p < 0.0001, n = 490/578; A549 KO/PAR: p < 0.0001, n = 337/395; Student’s T-test). C HTB56 EC and A549 HERC5 KO have a decreased NAD/NADH ratio compared to HTB56 HERC5 OE (p = 0.003, n = 3, Student’s T-test) and A549 PAR (p = 0.017, n = 3, Student’s T-test) cells, respectively. Error bars in bar plots are depicting the standard deviation

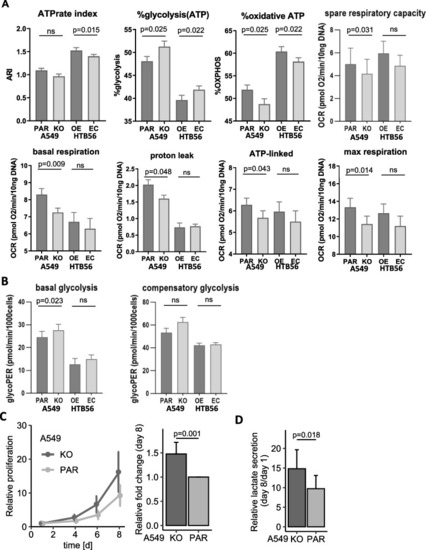
HERC5 KO switches metabolism from oxidative phosphorylation to aerobic glycolysis. A Loss of HERC5 expression shifts the ratio of ATP production in the cell to a decrease in mitochondrial energy production and toward glycolysis. The ATP rate index, as well as the ratio of glycolytic and oxidative ATP production, was altered in A549 PAR and HTB56 OE cells (ATPrate index: A549 KO/PAR: p = 0.082; HTB56 EC/OE: p = 0.015; glycolytic ATP: A549 KO/PAR: p = 0.025; HTB56 EC/OE: p = 0.022; oxidative ATP: A549 KO/PAR: p = 0.025; HTB56 EC/OE: p = 0.022; Paired t-test). Seahorse Mito stress assays also revealed an increase in basal respiration (p = 0.009; p = 0.314; Paired t-test), proton leak (p = 0.048; p = 0.667; Paired t-test), ATP-linked respiration (p = 0.043; p = 0.331; Paired t-test) and maximal respiration (p = 0.014; p = 0.274; Paired t-test) in A549 PAR cells compared to HERC5 KO cells and HTB56 HERC5 OE compared to EC cells, respectively. All the experiments were performed with n = 4. Error bars depict the standard deviation. B Glycolytic Rate Assay shows significant increase in basal glycolysis (p = 0.023, Paired t-test) and increase, although not significantly (p = 0.053, Paired t-test), compensatory glycolysis of A549 HERC5 KO cells compared to A549 PAR. There was no significant effect in the HTB56 HERC5 OE cell model. The Assay was performed with n = 4. Upon long-term treatment (8 days) with the ATP synthase inhibitor oligomycin (100 ng/mL), A549 KO/PAR cells showed C significantly elevated proliferation (p = 0.001, n = 11, one sample t-test) and D significantly elevated lactate levels in the supernatant of HERC5 KO cells (p = 0.018, n = 8, Paired t-test). Error bars are depicting the 95% confidence interval

Acknowledgments
This image is the copyrighted work of the attributed author or publisher, and ZFIN has permission only to display this image to its users. Additional permissions should be obtained from the applicable author or publisher of the image. Full text @ J. Exp. Clin. Cancer Res.