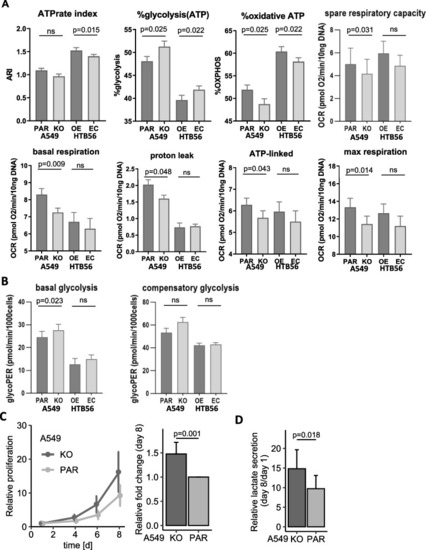
HERC5 KO switches metabolism from oxidative phosphorylation to aerobic glycolysis. A Loss of HERC5 expression shifts the ratio of ATP production in the cell to a decrease in mitochondrial energy production and toward glycolysis. The ATP rate index, as well as the ratio of glycolytic and oxidative ATP production, was altered in A549 PAR and HTB56 OE cells (ATPrate index: A549 KO/PAR: p = 0.082; HTB56 EC/OE: p = 0.015; glycolytic ATP: A549 KO/PAR: p = 0.025; HTB56 EC/OE: p = 0.022; oxidative ATP: A549 KO/PAR: p = 0.025; HTB56 EC/OE: p = 0.022; Paired t-test). Seahorse Mito stress assays also revealed an increase in basal respiration (p = 0.009; p = 0.314; Paired t-test), proton leak (p = 0.048; p = 0.667; Paired t-test), ATP-linked respiration (p = 0.043; p = 0.331; Paired t-test) and maximal respiration (p = 0.014; p = 0.274; Paired t-test) in A549 PAR cells compared to HERC5 KO cells and HTB56 HERC5 OE compared to EC cells, respectively. All the experiments were performed with n = 4. Error bars depict the standard deviation. B Glycolytic Rate Assay shows significant increase in basal glycolysis (p = 0.023, Paired t-test) and increase, although not significantly (p = 0.053, Paired t-test), compensatory glycolysis of A549 HERC5 KO cells compared to A549 PAR. There was no significant effect in the HTB56 HERC5 OE cell model. The Assay was performed with n = 4. Upon long-term treatment (8 days) with the ATP synthase inhibitor oligomycin (100 ng/mL), A549 KO/PAR cells showed C significantly elevated proliferation (p = 0.001, n = 11, one sample t-test) and D significantly elevated lactate levels in the supernatant of HERC5 KO cells (p = 0.018, n = 8, Paired t-test). Error bars are depicting the 95% confidence interval
|
