IMAGE

Fig. 3

ID
ZDB-IMAGE-240415-61
Source
Figures for Schneegans et al., 2024
Image
Figure Caption

Fig. 3

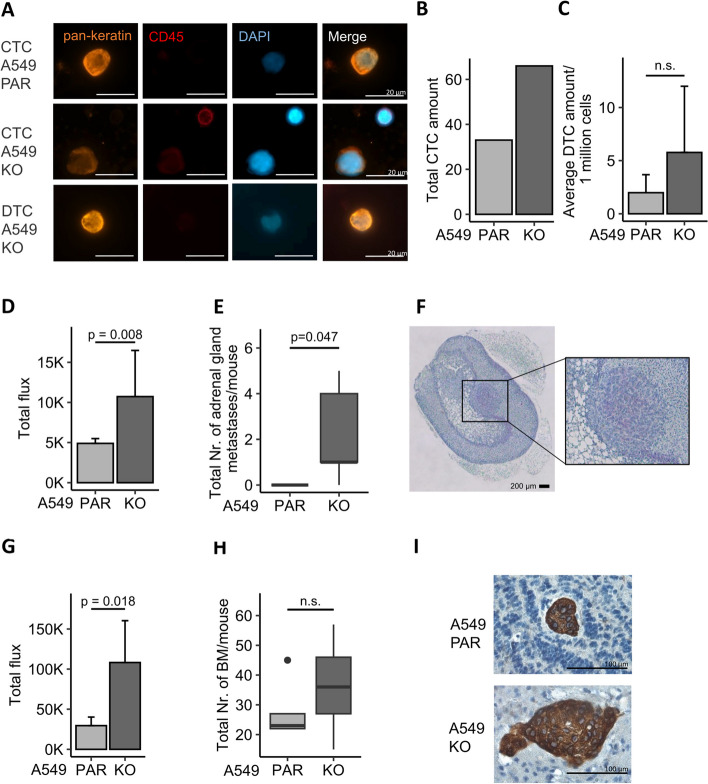
HERC5 inhibits tumor-associated aggressiveness in a mouse model.A Representative images of CTCs and DTCs detected in murine blood after intracardial injection of 500,000 A549 PAR-LUC and HERC5 KO-LUC cells. Tumor cells were enriched by a size-based enrichment technique and identified by pankeratin positivity, while CD45 was used as an exclusion marker. B Total CTC counts in pooled blood from 5 mice from the A549 PAR and HERC5 KO cohorts show an increase in CTCs in those mice injected with A549 HERC5 KO cells. C Average DTC amount per 1 million cells is elevated in HERC5 KO cells, however not significantly (n = 5). D and E Adrenal gland metastases were found only in the A549 HERC5 KO cohort; thus, the total number and volume per mouse were significantly increased compared to A549 PAR cohort (p = 0.047; n = 5; Mann–Whitney U test, respectively). F Representative image of adrenal gland metastases identified using HE staining. G and H The total number and volume of brain metastases per mouse were slightly higher in the A549 KO cohort; however, these differences were not significant (n = 5). I Representative image of brain metastases identified using pankeratin IHC staining and hematoxylin counterstaining. Error bars in bar plots are depicting the standard deviation

Acknowledgments
This image is the copyrighted work of the attributed author or publisher, and ZFIN has permission only to display this image to its users. Additional permissions should be obtained from the applicable author or publisher of the image. Full text @ J. Exp. Clin. Cancer Res.