FIGURE

Fig. 5

ID
ZDB-FIG-240415-58
Publication
Schneegans et al., 2024 - HERC5 downregulation in non-small cell lung cancer is associated with altered energy metabolism and metastasis
Other Figures
All Figure Page
Back to All Figure Page
Fig. 5

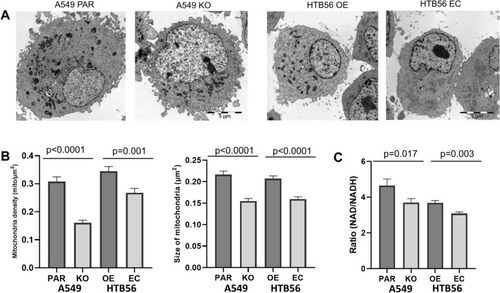
HERC5 induces changes in mitochondrial morphology. A Representative electron microscopy images of A549 PAR/KO and HTB56 OE/EC cells. B Mitochondrial density and size increase in cells with high HERC5 expression (density: HTB56 EC/OE: p = 0.001; A549 KO/PAR: p < 0.0001; n = 30; size: HTB56 EC/OE: p < 0.0001, n = 490/578; A549 KO/PAR: p < 0.0001, n = 337/395; Student’s T-test). C HTB56 EC and A549 HERC5 KO have a decreased NAD/NADH ratio compared to HTB56 HERC5 OE (p = 0.003, n = 3, Student’s T-test) and A549 PAR (p = 0.017, n = 3, Student’s T-test) cells, respectively. Error bars in bar plots are depicting the standard deviation

Expression Data

Expression Detail
Antibody Labeling
Phenotype Data

Phenotype Detail
Acknowledgments
This image is the copyrighted work of the attributed author or publisher, and ZFIN has permission only to display this image to its users. Additional permissions should be obtained from the applicable author or publisher of the image. Full text @ J. Exp. Clin. Cancer Res.