IMAGE

Fig. 4

ID
ZDB-IMAGE-240415-62
Source
Figures for Schneegans et al., 2024
Image
Figure Caption

Fig. 4

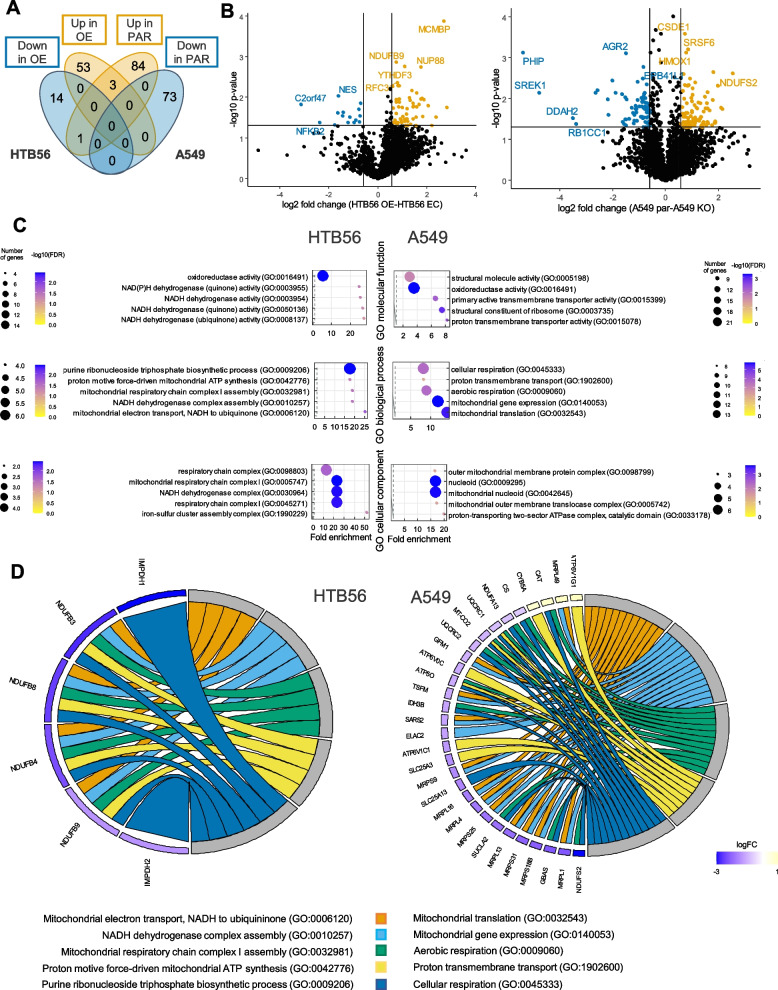
Proteomics reveals enrichment of proteins connected to mitochondrial metabolism in cell lines differentially expressing HERC5. A Venn diagram depicting differentially regulated proteins analyzed by mass spectrometry (n = 3). Four proteins were found dysregulated in both HTB56 and A549 cell line, with three of them upregulated in cells with high HERC5 expression. B Volcano plots depicting differentially expressed proteins (FC > 1.5, p value < 0.05, n = 3). Significantly downregulated proteins in HTB56 OE and A549 PAR cells are shown in blue, while upregulated proteins are presented in orange. C GO term enrichment analysis showing the top five significantly enriched proteins (using R package [37], n = 3) D Visualization of proteins involved in these GO terms for biological processes by using R package GOplot [38]

Acknowledgments
This image is the copyrighted work of the attributed author or publisher, and ZFIN has permission only to display this image to its users. Additional permissions should be obtained from the applicable author or publisher of the image. Full text @ J. Exp. Clin. Cancer Res.