
- Title
-
Activating SRC/MAPK signaling via 5-HT1A receptor contributes to the effect of vilazodone on improving thrombocytopenia
- Authors
- Zhou, L., Ni, C., Liao, R., Tang, X., Yi, T., Ran, M., Huang, M., Liao, R., Zhou, X., Qin, D., Wang, L., Huang, F., Xie, X., Wan, Y., Luo, J., Wang, Y., Wu, J.
- Source
- Full text @ Elife
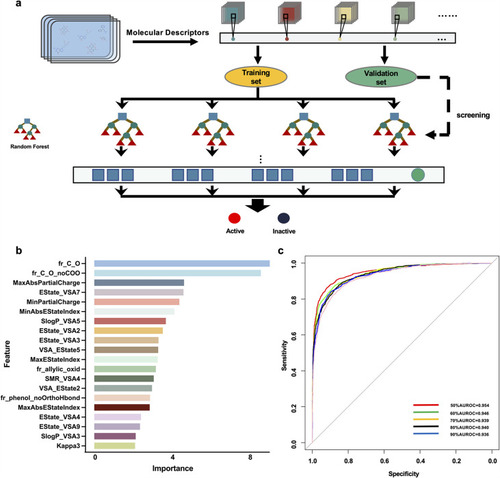
Drug screening model construction. ( |
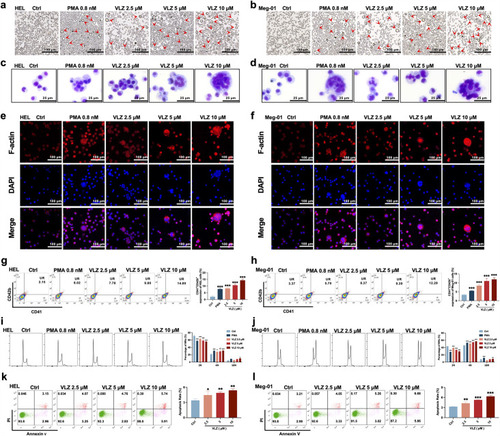
VLZ promotes megakaryocyte differentiation and enhances the DNA ploidy of HEL and Meg-01 cells. (a, b) Representative images of HEL and Meg-01 cells treated with different concentrations of VLZ (2.5, 5, and 10 μM) for 5 days. Bars represent 100 μm. The positive control was PMA. (c, d) Giemsa staining of HEL and Meg-01 cells treated with VLZ (2.5, 5, and 10 μM) or PMA for 5 days. Bars represent 25 μm. (e, f) Phalloidin staining of HEL and Meg-01 cells treated with VLZ (2.5, 5, and 10 μM) or PMA for 5 days. DAPI staining nuclei (blue) and Phalloidin staining of F-actin (red). Bars represent 100 μm. (g, h) Flow cytometry analysis of the percentage of CD41+/CD42b+ complexes surface expression on HEL and Meg-01 cells by VLZ (2.5, 5, and 10 μM) or PMA for 5 days. The histogram shows the percentage of CD41+/CD42b+ cells for each group. (i, j) Flow cytometry analysis of the DNA ploidy of HEL and Meg-01 cells treated with VLZ (2.5, 5, and 10 μM) or PMA for 5 days. The histogram shows the percentages of DNA ploidy. (k, l) Flow cytometry analysis of the cell apoptosis of HEL and Meg-01 cells treated with VLZ (2.5, 5, and 10 μM) or PMA for 5 days. Data are shown as the mean ± SD from three independent experiments. *p≤0.05, **p≤0.01, and ***p≤0.001, vs the control group. |
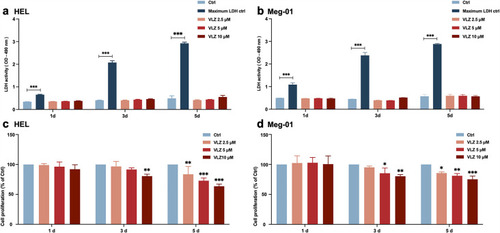
Safe concentration of VLZ for treatment of HEL and Meg-01. ( |
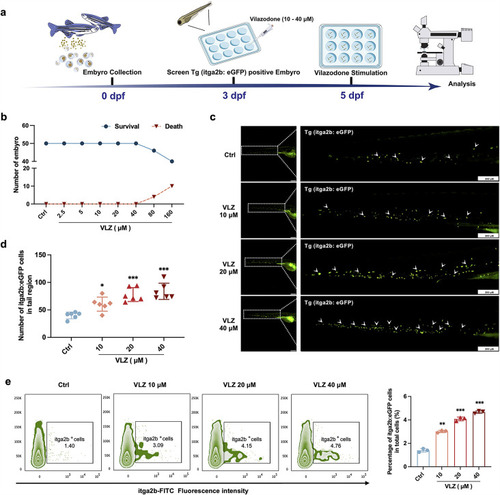
VLZ administration enhances thrombogenesis in Tg (itga2b: eGFP) transgenic zebrafish. ( |

VLZ administration counteracts radiation-induced thrombocytopenia in vivo. (a) Schematic diagram of thrombopoietin (TPO) (3000 U/kg) and VLZ (2.5, 5, and 10 mg/kg) administration in Kunming (KM) mice with thrombocytopenia induced by IR. (b–d) Peripheral blood counts showing (b) platelet counts, (c) mean platelet volume (MPV) and (d) RBC on days 0, 4, 7, 10, and 12 post-IR. In B to E, (n=12 per group) the data are expressed as the mean ± SD, and two-way ANOVA with Tukey’s multiple comparisons test was used unless otherwise specified. *p≤0.05, **p≤0.01, and ***p≤0.001, vs the model group. (e) Flow cytometry analysis indicates the expression of CD41 and CD61 in peripheral blood cells after receiving therapy for 12 days. The histogram represents the percentage of CD41+/CD61+ cells in each group. (f) Representative image of CD62p in washed platelets in each group. (g) Representative images of CD62p in ADP (10 mM) washed platelets in each group. (h) Micrographs of collagen-coated slides with the same number of platelets perfused. Red represents platelets. The histogram shows the average of red fluorescence on the whole surface by ImageJ software. (i) Platelet aggregation was measured by a turbidimetric aggregation-monitoring device under ADP stimulation. The histogram represents the aggregation results expressed as the maximum aggregation amplitude of platelets in each group. (j) The rate tracings of carotid blood flow. The histogram shows the mean carotid artery occlusion times of each group. (k) Tail bleeding time was measured in each group. (l) Representative images of whole blood clots at times 0, 60, and 120 min (end point) in each group. The histogram represents the percentage of final clot weight. (m) Representative images of washed platelet clots at time 0 and 120 min (endpoint) in each group. The histogram shows clot retraction at 120 min as a percentage of clot area from 0 min. The data represent the mean ± SD of three independent experiments. *p≤0.05, **p≤0.01, and ***p≤0.001, vs the model group. |

VLZ promotes platelet increase in normal mice. ( |
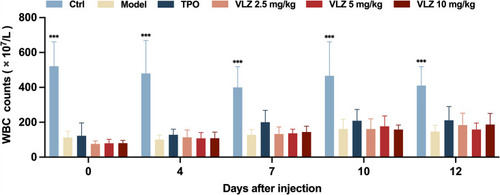
WBC counts. Peripheral blood counts showing WBC on days 0, 4, 7, 10, and 12 post-IR. In B to E, (n=12 per group) the data are expressed as the mean ± SD, and two-way ANOVA with Tukey’s multiple comparisons test was used unless otherwise specified, *p≤0.05, **p≤0.01, and ***p≤0.001, vs the model group. |
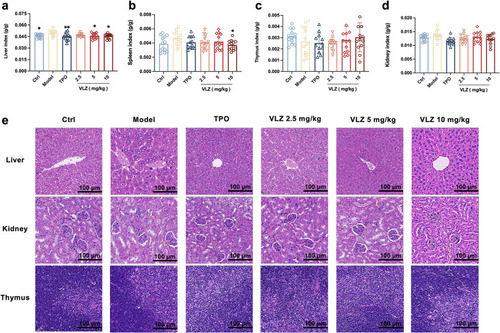
Toxicity evaluation of VLZ in vivo. ( |

VLZ rescues bone marrow and splenic hematopoiesis after radiation injury. ( |
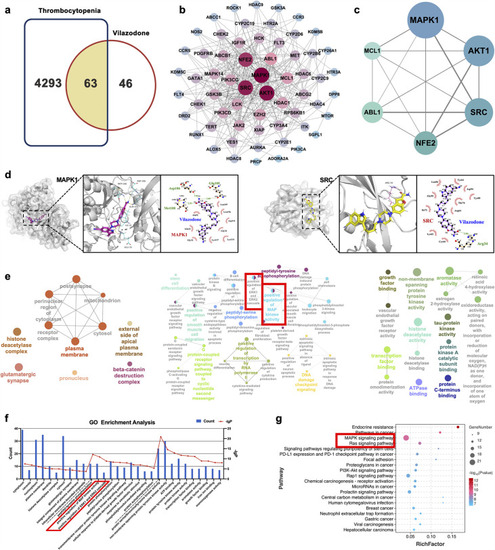
Network pharmacology and molecular docking analysis of VLZ activity in thrombocytopenia. ( |
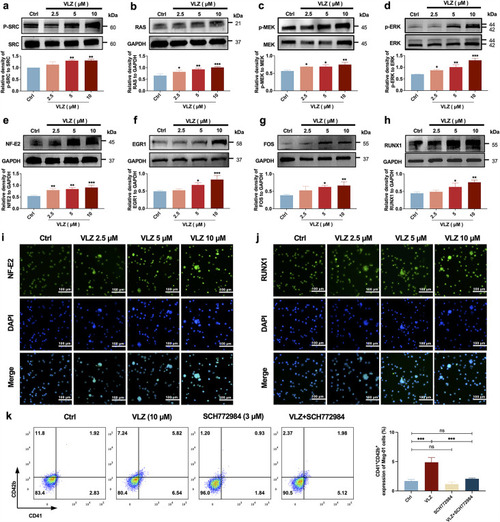
VLZ induces megakaryocyte (MK) maturation and differentiation by activating the SRC/RAS/MEK/ERK signaling pathway. (a-h) The expression of SRC, RAS, MEK, ERK, NF-E2, EGR1, FOS, and RUNX1 were detected by western blot after Meg-01 cells were treated with VLZ (2.5, 5, and 10 μM) for 5 days (n=3 per group). (i, j) Immunofluorescence analysis of the expression of NF-E2 and RUNX1 in Meg-01 cells after VLZ (2.5, 5, and 10 μM) intervention for 5 days. Cells were stained with DAPI for nuclei (blue) and antibodies for NF-E2 (green). Bars represent 100 μm. (k) Flow cytometry analysis of the percentage of CD41+ CD42b+ complexes surface expression on HEL and Meg-01 cells treated with VLZ (10 μM), SCH772984 (3 μM), and VLZ (10 μM)+SCH772984 (3 μM) treated for 5 days. The histogram shows the percentage of CD41+/CD42b+ cells for each group. The data represent the mean ± SD of three independent experiments. *p≤0.05, **p≤0.01, and ***p≤0.001, ns: no significance, vs the control group. |
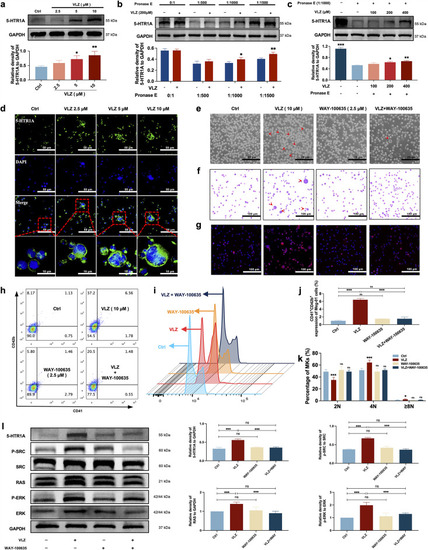
VLZ stimulates megakaryocytopoiesis via the 5-HT1A receptor. (a) Representative immunoblot images and biochemical quantification of 5-HTR1A after treatment with VLZ (2.5, 5, and 10 μM) in Meg-01 cells for 5 days (n=3 per group). (b) The DARTS assay for target validation. 5-HTR1A protein stability was increased upon VLZ (200 μM) treatment in Meg-01 lysates. Pronase was added using several dilutions (1:500, 1:1000, or 1500) from 50 μg/mL stock for 10 min at 40 °C (n=3 per group). (c) The DARTS assay demonstrated the dose-dependent binding of VLZ to 5-HTR1A in Meg-01 cells. Treatment with pronase (1:1000) was conducted for 10 min at 40 °C (n=3 per group). (d) Immunofluorescence analysis of the expression of 5-HTR1A in Meg-01 cells after VLZ (2.5, 5, and 10 μM) intervention for 5 days. Cells were stained with DAPI for nuclei (blue) and antibodies for 5-HTR1A (green). Bars represent 100 μm. (e–k) Meg-01 cells were treated with VLZ (10 μM), WAY-100635 (2.5 μM), VLZ (10 μM)+WAY-100635 (2.5 μM) for 5 days. (e) Representative images, bars represent 25 μm. (f) Giemsa staining of Meg-01 cells, bars represent 100 μm. (g) Phalloidin staining of Meg-01 cells, bars represent 100 μm. (h, i) Flow cytometry analysis of the expression of CD41/CD42b and the DNA ploidy. (j, k) The histogram shows the percentage of CD41+/CD42b+ cells and DNA ploidy for each group. (l) Western blot analysis of 5-HTR1A, RAS and ERK expression after Meg-01 cells were treated with VLZ (10 μM), WAY-100635 (2.5 μM), and VLZ (10 μM)+WAY-100635 (2.5 μM) for 5 days. The histogram shows the expression of 5-HTR1A, RAS, and ERK in each group (n=3 per group). The data represent the mean ± SD of three independent experiments. *p≤0.05, **p≤0.01, and ***p≤0.001, ns: no significance, vs the control group. |

Schematic representation of the mechanism by which VLZ regulates megakaryocyte differentiation and thrombopoiesis. |