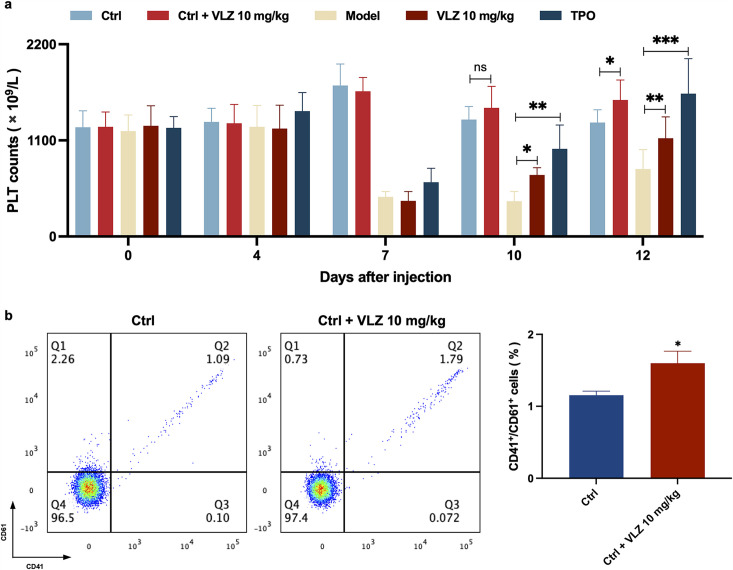
Figure 4—figure supplement 1.
VLZ promotes platelet increase in normal mice.
(a) Peripheral blood counts showing platelet counts on days 0, 4, 7, 10, and 12. (n=8 per group) the data are expressed as the mean ± SD, and two-way ANOVA with Tukey’s multiple comparisons test was used unless otherwise specified, *p≤0.05, **p≤0.01, and ***p≤0.001. (b) Flow cytometry analysis indicates the expression of CD41 and CD61 in peripheral blood after receiving therapy for 12 days. The histogram represents the percentage of CD41+/CD61+ cells in each group. The data represent the mean ± SD of three independent experiments. *p≤0.05, **p≤0.01, and ***p≤0.001, vs the control group.
Acknowledgments
This image is the copyrighted work of the attributed author or publisher, and
ZFIN has permission only to display this image to its users.
Additional permissions should be obtained from the applicable author or publisher of the image.
Full text @ Elife
Your Input Welcome
Thank you for submitting comments. Your input has been emailed to ZFIN curators who may contact you if
additional information is required.
Oops. Something went wrong. Please try again later.