Image


                        Figure Caption


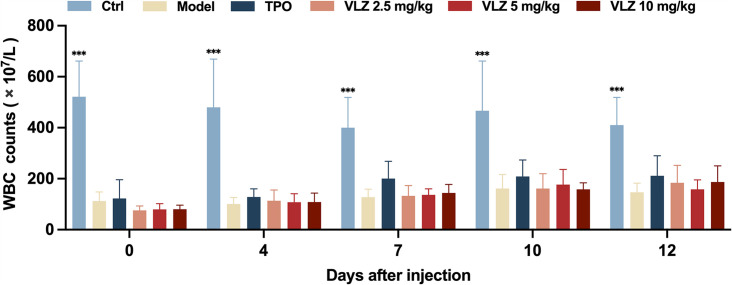
Figure 4—figure supplement 2. WBC counts.
Peripheral blood counts showing WBC on days 0, 4, 7, 10, and 12 post-IR. In B to E, (n=12 per group) the data are expressed as the mean ± SD, and two-way ANOVA with Tukey’s multiple comparisons test was used unless otherwise specified, *p≤0.05, **p≤0.01, and ***p≤0.001, vs the model group.
                
                    
                        Acknowledgments


This image is the copyrighted work of the attributed author or publisher, and
ZFIN has permission only to display this image to its users.
Additional permissions should be obtained from the applicable author or publisher of the image.
      Full text @ Elife


        