FIGURE SUMMARY
Title

High Oestrogen receptor alpha expression correlates with adverse prognosis and promotes metastasis in colorectal cancer

Authors
Topi, G., Satapathy, S.R., Ghatak, S., Hellman, K., Ek, F., Olsson, R., Ehrnström, R., Lydrup, M.L., Sjölander, A.
Source
Full text @ Cell Commun. Signal.

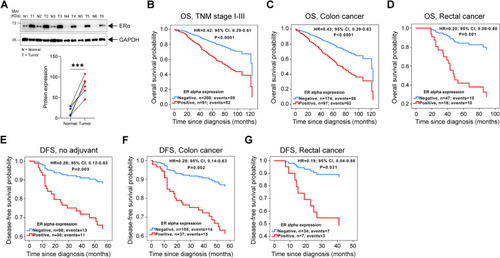
ERα expression and its prognostic association in colorectal cancer (CRC) patients. A Western blot of ERα protein expression in six paired colon cancer (CC) patient samples of normal (N) and tumour (T) colon tissue. GAPDH was used as a loading control. Graph showing the densitometric analysis of ERα protein expression compared between normal (N) and tumour (T) tissues. Kaplan-Meier survival curves for OS: B multivariate model for CRC patients with stage I-III disease, n = 299; C multivariate model for patients with colon cancer, n = 271; and D multivariate model for patients with rectal cancer, n = 63. Kaplan-Meier survival curves for DFS: E multivariate model for patients who did not receive adjuvant treatment after surgery, n = 128; F multivariate model for patients with colon cancer, n = 142; and G multivariate model for patients with rectal cancer, n = 41. P values < 0.5 were considered significant and determined by the log-rank test

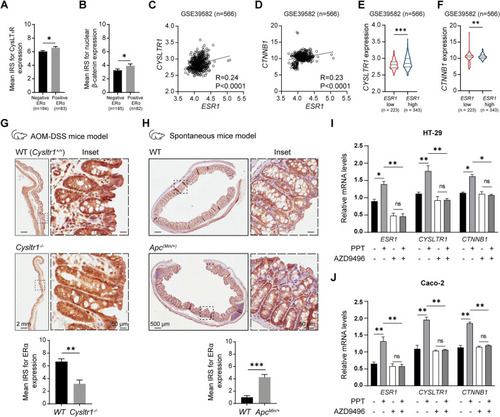
ERα expression positively correlates with tumour promoter expression in colon cancer. Mean immuno-reactive score (IRS) for (A) Cysteinyl leukotriene receptor 1 (CysLT1R) and (B) nuclear β-catenin expression in colorectal cancer (CRC) patients (n = 267) with negative and positive ERα expression. XY scatter plots of the mRNA levels of (C) ERα (ESR1) and CysLT1R (CYSLTR1) and (D) ERα (ESR1) and β-catenin (CTNNB1) in the GSE39582 public dataset (n = 566) of CRC patients. Violin plots showing the mRNA expression of (E) CYSLTR1 and (F) CTNNB1 in CRC patients with low or high ESR1 expression. G Immunohistochemical (IHC) images of ERα expression in the colons of wild-type (WT) and Cysltr1 knockout (Cysltr1−/−) mice in a colitis-associated colon cancer (CAC) mouse model (n = 5). Bar graph showing the IRS of ERα expression compared between the WT and Cysltr1−/− mouse groups. H IHC images of ERα expression in the colons of WT and ApcMin/+ mice, n = 5. Bar graph showing the IRS of ERα expression in the WT and Cysltr1−/− mouse groups. For both mouse models, four random regions of interest (ROIs; marked with dotted lines) in colon tissue were evaluated for each mouse. Representative images of one ROI are shown as insets. The scale bars represent 2 mm (G) and 500 μm (H) in the image of the whole colon and 50 μm in the zoomed insets. P values were calculated using an unpaired Student’s t test for the bar graphs in G and H. Relative mRNA expression levels of ESR1, CYSLTR1, and CTNNB1 in (I) HT-29 and (J) Caco-2 CC cells after treatment with PPT (ERα specific agonist, 40 nM) or AZD9496 (ERα specific antagonist, 0.3 nM for 30 min) alone or in combination of PPT (40 nM) with AZD9496 (0.3 nM for 30 min before the PPT treatment). The data are presented as the mean ± SEM (n = 3 independent experiments). P values < 0.5 were considered significant were calculated using an unpaired Student’s t test

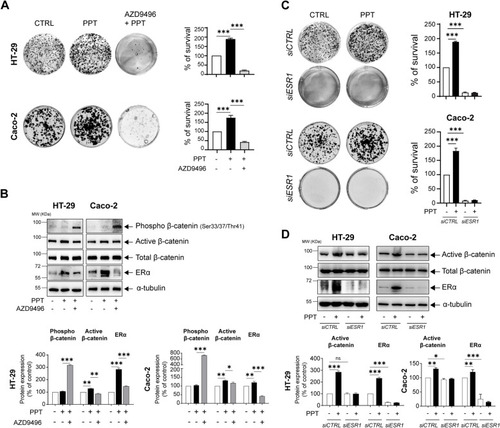
ERα activation in colon cancer cells promotes survival. A Alterations in the colonies formed by HT-29 and Caco-2 colon cancer (CC) cells treated with PPT (40 nM) alone for 48 h or in combination with AZD9496 (0.3 nM, for 30 min before PPT treatment). Bar graphs show the percentage of survival and are representative of n = 3 independent experiments. B Western blots showing the protein levels of phospho-β-catenin (Ser33/37/Thr41), non-phospho (active)-β-catenin, total β-catenin, and ERα in HT-29 and Caco-2 cells untreated or treated with PPT (40 nM) alone or in combination with AZD9496 (0.3 nM, for 30 min). Graphs showing the densitometric analysis of alterations in phospho- and non-phospho (active)-β-catenin and ERα protein levels as percentages of the loading control (α-tubulin). The blots are representative of n = 3 independent experiments. C Alterations in the colonies formed by HT-29 and Caco-2 cells transfected with either siCTRL or siESR1 prior to PPT (40 nM) treatment for 48 h. The graphs show the percentage of survival in each group. D Western blots showing the protein levels of non-phospho (active)-β-catenin, total β-catenin, and ERα in both HT-29 and Caco-2 cells transfected with either siCTRL or siESR1 prior to PPT (40 nM) treatment. Graphs showing the densitometric analysis of alterations in ERα and non-phospho (active)-β-catenin protein levels as percentages of the loading control (α-tubulin). The blots are representative of n = 3 independent experiments. The data are presented as the means ± SEMs. P values < 0.5 were considered significant calculated using an unpaired Student’s t test

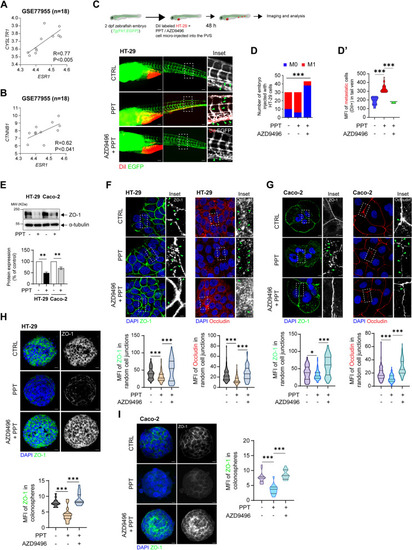
Activation of ERα promotes colon cancer cell metastasis. An external dataset composed of data for CC patients with liver metastasis (GSE77955, n = 18) was used to analyse the correlations of CysLT1R (CYSLTR1) and β-catenin (CTNNB1) with ERα (ESR1). The scatter plots show the positive correlations between ESR1 and both (A) CYSLTR1 and (B) CTNNB1. C Schematic cartoon showing the zebrafish embryo-based colon cancer metastasis model. DiI-labelled HT-29 cells left untreated or treated with PPT alone or in combination with AZD9496 were injected into the perivitelline space of 2 dpf zebrafish embryos, and the embryos were incubated for 48 h. Images showing the metastatic spread of HT-29 cells in the tail veins of zebrafish embryos in each group (CTRL, n = 30; PPT, n = 30; AZD9496 + PPT, n = 43). Scale bars: full-size images; 10 μm, insets; 2 μm. The insets show the regions enclosed in the dotted lines in the full-size tail images. The arrows point to the metastatic foci and transendothelial migration of cancer cells. D Graphs showing the number of embryos with (M1, mets) or without (M0, no mets) metastasis in each group and D′, quantification of tail vein metastasis using the mean fluorescence intensity (MFI) of the embryos with metastasis. E Western blots showing the expression of the tight junction protein ZO-1 in HT-29 and Caco-2 cells treated with PPT (40 nM) alone or in combination with AZD9496 (0.3 nM, 30 min). Graph showing the densitometric analysis of alterations in protein expression as a percentage of the loading control (α-tubulin). The blots are representative of n = 3 independent experiments. For the bar graphs, unpaired t-test was used. F Immunofluorescence analysis of ZO-1 and Occludin expression in HT-29 cells treated with PPT (40 nM) alone or in combination with AZD9496 (0.3 nM, 30 min). Greyscale images (insets) showing a representative region of interest (dotted line) for ZO-1 and Occludin staining. Scale bars: full-size images; 5 μm, insets; 1 μm. Violin plots showing the mean fluorescence intensity of ZO-1 (CTRL, n = 116; PPT, n = 105, AZD9496 + PPT, n = 107) and Occludin in random cell-cell junctions (CTRL, n = 103; PPT, n = 110, AZD9496 + PPT, n = 108). P values were calculated with unpaired Student’s t test. The arrows indicate gaps in ZO-1 expression. G Immunofluorescence analysis of ZO-1 and Occludin expression in Caco-2 cells treated with PPT (40 nM) alone or in combination with AZD9496 (0.3 nM, 30 min). Greyscale images (insets) showing representative regions of interest for ZO-1 and Occludin staining. Scale bars: full-size images; 5 μm, insets; 1 μm. Violin plots showing the mean fluorescence intensity of ZO-1 (CTRL, n = 108; PPT, n = 116, AZD9496 + PPT, n = 105) and Occludin (CTRL, n = 105; PPT, n = 115, AZD9496 + PPT, n = 116) in random cell-cell junctions. The arrows indicate gaps in ZO-1 or Occludin expression. H Immunofluorescence analysis of ZO-1 in HT-29 cell-derived colonospheres treated with PPT (40 nM) alone or in combination with AZD9496 (0.3 nM, 30 min). Scale bars: 10 μm. Violin plot showing the mean fluorescence intensity of ZO-1 in random colonospheres (CTRL, n = 31; PPT, n = 28, AZD9496 + PPT, n = 30). The arrows indicate ZO-1 expression in the disseminated cells from the colonospheres. I Immunofluorescence analysis of ZO-1 in Caco-2 CC cell-derived colonospheres treated with PPT (40 nM) alone or in combination with AZD9496 (0.3 nM, 30 min). Scale bars: 10 μm. Violin plot showing the mean fluorescence intensity of ZO-1 in random colonospheres (CTRL, n = 29; PPT, n = 26, AZD9496 + PPT, n = 28). The data are presented as the mean ± SEM of three experiments. P values < 0.5 were considered significant were calculated using the chi-square test in D and an unpaired Student’s t test in D′-I

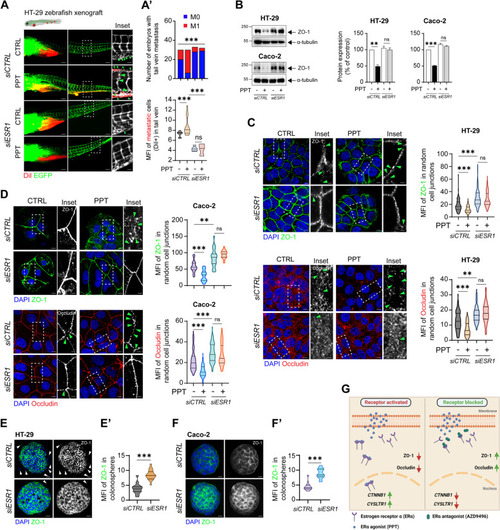
Functional absence of ERα inhibits colon cancer cell metastasis. DiI-labelled HT-29 cells transfected with either siCTRL or siESR1 and treated with or without PPT for 48 h were injected into the perivitelline space of 2 dpf zebrafish embryos, and the embryos were incubated for 48 h. A Images showing the metastatic spread of HT-29 cells in the tail veins of zebrafish embryos in each group (siCTRL; CTRL, n = 30; PPT, n = 30; siESR1; CTRL, n = 33, PPT, n = 32). Graphs showing A’, the number of embryos with (M1, mets) or without metastasis (M0, no mets) in each group and A”, the quantification of tail vein metastasis using the mean fluorescence intensity (MFI) of the embryos with metastasis (M1 group). Scale bars: full-size images; 10 μm, insets; 2 μm. The insets show the regions enclosed in the dotted lines in the full-size tail images. The arrows point to the metastatic foci and transendothelial migration of cancer cells. B Western blots showing the expression of the tight junction protein ZO-1 in HT-29 and Caco-2 cells transfected with either siCTRL or siESR1 prior to PPT (40 nM) treatment. Graphs showing the densitometric analysis of alterations in protein expression as a percentage of the loading control (α-tubulin). The blots are representative of n = 3 independent experiments. C Immunofluorescence analysis of ZO-1 and Occludin expression in HT-29 cells transfected with either siCTRL or siESR1 prior to treatment with the ERα agonist PPT (40 nM). Greyscale images (insets) showing representative regions of interest for ZO-1 and Occludin staining. Scale bars: full-size images; 5 μm, insets; 1 μm. Violin plots showing the mean fluorescence intensity of ZO-1 (siCTRL (CTRL, n = 105; PPT, n = 115), siESR1 (CTRL, n = 108; PPT, n = 116)) and Occludin (siCTRL (CTRL, n = 105; PPT, n = 105), siESR1 (CTRL, n = 107; PPT, n = 102)) in random cell-cell junctions. The arrows indicate gaps in ZO-1 or Occludin expression. D Immunofluorescence analysis of ZO-1 and Occludin expression in Caco-2 cells transfected with either siCTRL or siESR1 prior to treatment with the ERα agonist PPT (40 nM). Greyscale images (insets) showing representative regions of interest for ZO-1 and Occludin staining. Scale bars: full-size images; 5 μm, insets; 1 μm. Violin plots showing the mean fluorescence intensity of ZO-1 and Occludin in random cell junctions. For ZO-1 staining in the siCTRL-transfected group (CTRL, n = 105; PPT, n = 105) and in the siESR1-transfected group (CTRL, n = 108; PPT, n = 105), random cell junctions were evaluated. For Occludin staining in the siCTRL-transfected group (CTRL, n = 105; PPT, n = 105) and in the siESR1-transfected group (CTRL, n = 102; PPT, n = 108), random cell junctions were evaluated. The arrows indicate gaps in ZO-1 or Occludin expression. Immunofluorescence analysis of ZO-1 in colonospheres derived from either siCTRL or siESR1 transfected (E) HT-29 and (F) Caco-2 cells. Scale bars: 10 μm. Violin plots showing the mean fluorescence intensity of ZO-1 in random (E’) HT-29 (siCTRL, n = 30; siESR1, n = 32) or (F′) Caco-2 (siCTRL, n = 28; siESR1, n = 31) colonospheres. The MFIs of the indicated proteins were measured using ImageJ software (NIH, USA). G Graphical representation of the summary of the study. Upon binding to the agonist PPT, ERα dimerizes and shuttles into the nucleus. This upregulates the transcription of CYSLTR1 and CTNNB1. In addition, it promotes metastasis by disrupting the tight junction proteins ZO-1 and Occludin. However, blocking the binding of PPT to ERα by employing an antagonist, AZD9496, prevents the activation and hence the dimerization of the receptor. This further leads to downregulation of CYSLTR1 and CTNNB1 and upregulation of the tight junction proteins ZO-1 and Occludin. The data are presented as the mean ± SEM of three experiments. P values were calculated with the chi-square test for A’ and unpaired Student’s t test for A”, B-F

Acknowledgments
This image is the copyrighted work of the attributed author or publisher, and ZFIN has permission only to display this image to its users. Additional permissions should be obtained from the applicable author or publisher of the image. Full text @ Cell Commun. Signal.