IMAGE

Fig. 1

ID
ZDB-IMAGE-240401-32
Source
Figures for Topi et al., 2024
Image
Figure Caption

Fig. 1

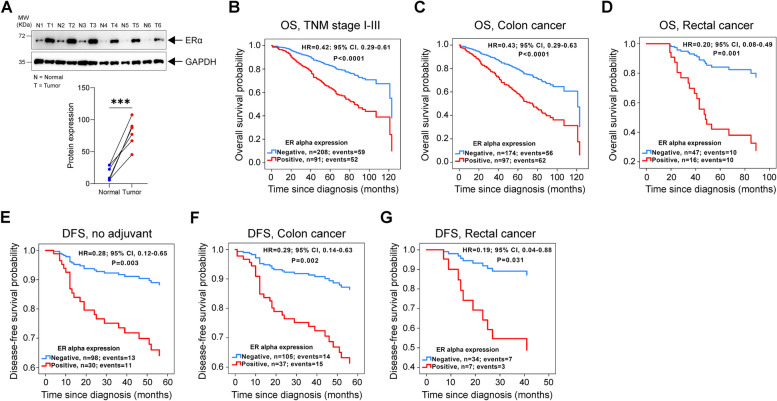
ERα expression and its prognostic association in colorectal cancer (CRC) patients. A Western blot of ERα protein expression in six paired colon cancer (CC) patient samples of normal (N) and tumour (T) colon tissue. GAPDH was used as a loading control. Graph showing the densitometric analysis of ERα protein expression compared between normal (N) and tumour (T) tissues. Kaplan-Meier survival curves for OS: B multivariate model for CRC patients with stage I-III disease, n = 299; C multivariate model for patients with colon cancer, n = 271; and D multivariate model for patients with rectal cancer, n = 63. Kaplan-Meier survival curves for DFS: E multivariate model for patients who did not receive adjuvant treatment after surgery, n = 128; F multivariate model for patients with colon cancer, n = 142; and G multivariate model for patients with rectal cancer, n = 41. P values < 0.5 were considered significant and determined by the log-rank test

Acknowledgments
This image is the copyrighted work of the attributed author or publisher, and ZFIN has permission only to display this image to its users. Additional permissions should be obtained from the applicable author or publisher of the image. Full text @ Cell Commun. Signal.