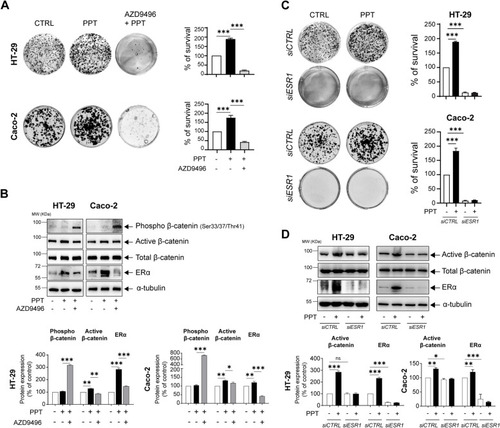
ERα activation in colon cancer cells promotes survival. A Alterations in the colonies formed by HT-29 and Caco-2 colon cancer (CC) cells treated with PPT (40 nM) alone for 48 h or in combination with AZD9496 (0.3 nM, for 30 min before PPT treatment). Bar graphs show the percentage of survival and are representative of n = 3 independent experiments. B Western blots showing the protein levels of phospho-β-catenin (Ser33/37/Thr41), non-phospho (active)-β-catenin, total β-catenin, and ERα in HT-29 and Caco-2 cells untreated or treated with PPT (40 nM) alone or in combination with AZD9496 (0.3 nM, for 30 min). Graphs showing the densitometric analysis of alterations in phospho- and non-phospho (active)-β-catenin and ERα protein levels as percentages of the loading control (α-tubulin). The blots are representative of n = 3 independent experiments. C Alterations in the colonies formed by HT-29 and Caco-2 cells transfected with either siCTRL or siESR1 prior to PPT (40 nM) treatment for 48 h. The graphs show the percentage of survival in each group. D Western blots showing the protein levels of non-phospho (active)-β-catenin, total β-catenin, and ERα in both HT-29 and Caco-2 cells transfected with either siCTRL or siESR1 prior to PPT (40 nM) treatment. Graphs showing the densitometric analysis of alterations in ERα and non-phospho (active)-β-catenin protein levels as percentages of the loading control (α-tubulin). The blots are representative of n = 3 independent experiments. The data are presented as the means ± SEMs. P values < 0.5 were considered significant calculated using an unpaired Student’s t test
|
