- Title
-
MFSD12 depletion reduces cystine accumulation without improvement in proximal tubular function in experimental models for cystinosis
- Authors
- Bondue, T., Khodaparast, L., Khodaparast, L., Cairoli, S., Goffredo, B.M., Gijsbers, R., van den Heuvel, L., Levtchenko, E.
- Source
- Full text @ Am. J. Physiol. Renal Physiol.
|
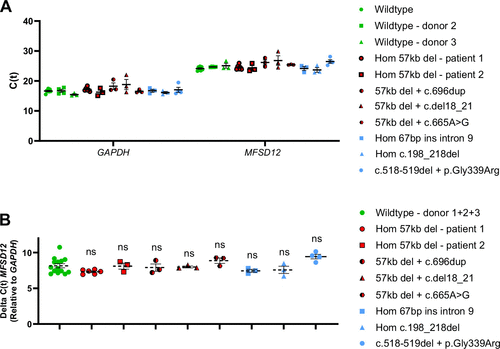
Basal MFSD12 mRNA levels are comparable between WT and CYS ciPTECs. A: ciPTECs were derived from the urine of three control individuals (WT) and eight patients with cystinosis with different CTNS genotypes. C(t)s are shown for GAPDH (left) and MFSD12 (right). Each dot represents a biological replicate and means with SE are shown. B: ΔC(t)s were pooled from the WT ciPTECs and compared with the CYS ciPTECs (one-way ANOVA, ns = no significance). C(t), threshold cycle; CYS, cystinosis; ciPTEC, conditionally immortalized proximal tubular epithelial cell; WT, wild type. |
|
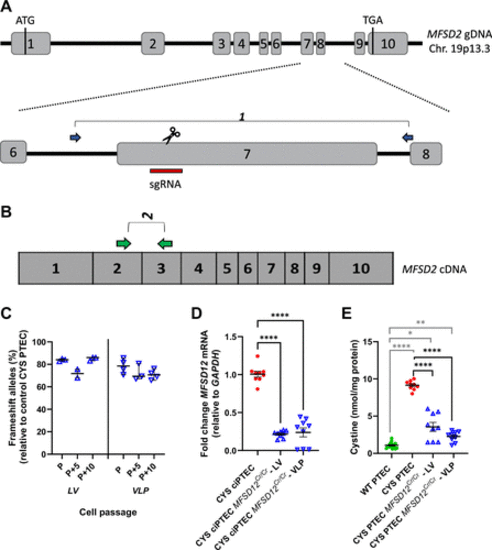
CYS ciPTEC MFSD12Cr/Cr was generated by CRISPR/Cas9 gene editing in MFSD12 exon 7 and presented reduced cystine levels. A: schematic representation of the genomic locus of MFSD12. Exons are indicated in numbered boxes, with the start and stop codons. Gene editing was performed in the CYS ciPTECs with lentiviral vectors (LVs) and virus-like particles (VLPs) with a sgRNA directed toward exon 7 (red bar). The blue arrows indicate the location of primer pair 1 for sequencing. B: the green arrows show primer pair 2 on the MFSD12 cDNA for Q-RT-PCR. C: the multiclonal line reads from the CYS ciPTEC MFSD12Cr/Cr-LV and -VLP were deconvoluted with DECODR. The % of frameshift alleles is shown for a 10-passage range (passage P, P + 5 and P + 10). Each dot represents a replicate from a total of three experiments. Data were analyzed with Kruskal–Wallis tests and a median with 95% CI is shown. D: MFSD12 mRNA levels were measured in the CYS ciPTEC MFSD12Cr/Cr-LV and -VLP compared with the unedited controls. Each dot represents a replicate from three independent experiments. Data were compared with CYS ciPTEC with one-way ANOVA. ****P < 0.0001. E: CYS ciPTEC MFSD12Cr/Cr cells were collected for cystine analysis after differentiation for 10 days at 37°C. Nine biological replicates, from 3 independent experiments, are represented. Data were compared with the CYS ciPTEC and the wildtype (WT) reference with Welch’s ANOVA and Dunnett’s multiple testing. Means with SE are shown. CYS, cystinosis; ciPTEC, conditionally immortalized proximal tubular epithelial cell. *P < 0.05; **P < 0.01; ****P < 0.0001. |
|
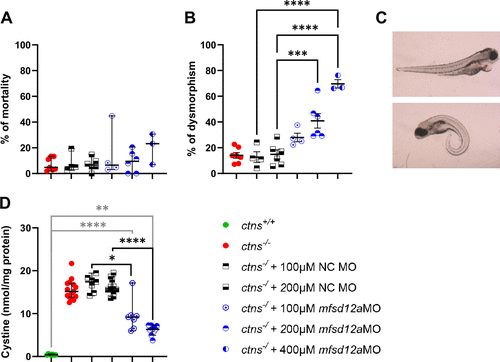
mfsd12a morpholino in ctns−/− embryos reduced cystine levels. A and B: ctns−/− embryos were injected with 100 µM, 200 µM, or 400 µM mfsd12a translation-blocking morpholino’s (TB MO). Cumulative mortality (A) and dysmorphism (B) were quantified. Average n = 75.9 (ctns−/−), 40.5 (+100 µM NC MO), 54.2 (+200 µM NC MO), 50.0 (+100 µM mfsd12a TB MO), 62.2 (+200 µM mfsd12a TB MO), and 81.7 (+400 µM mfsd12a TB MO). Median with 95% CI is shown for mortality rate and means ± SE for dysmorphism. Significance was tested by a Kruskal–Wallis test and one-way ANOVA, respectively. ***P < 0.001; ****P < 0.0001. C: both pericardial edema (top) and/or a curved spine (bottom) were counted. D: cystine levels were assessed at 72 h post-injection of mfsd12a TB MO and compared with the ctns−/− and ctns+/+ zebrafish by Kruskal–Wallis tests. Each dot represents a single measurement (n = 8 for ctns+/+, n = 15 for ctns−/− , n = 7 for ctns−/− + 100 µM NC MO and mfsd12a MO, n = 11 for ctns−/− + 200µM NC MO and mfsd12a MO). *P < 0.05; **P < 0.01; ****P < 0.0001. PHENOTYPE:
|
|
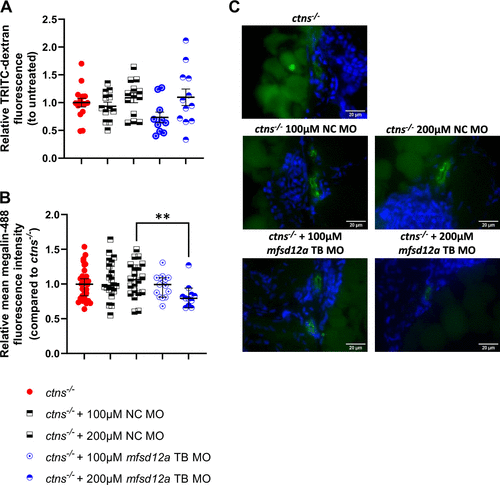
mfsd12a knockdown cannot ameliorate the proximal tubular dysfunction in ctns−/− zebrafish. A: morpholino-treated zebrafish were injected with 4.4 kDa TRITC-dextran in the circulation at 72 h post-injection. Fluorescence of the proximal tubular region was evaluated after 60 min in relation to the mean fluorescence in the untreated fish. Significance was evaluated with a one-way ANOVA and mean with SE is indicated. Each dot represents a single tubular region from three to four individual fish. **P < 0.01. B and C: 72 h post-injection, zebrafish sections were stained with Hoechst-33342 (blue) and for megalin (green). Megalin-488 fluorescence was quantified for each tubule (n = 7–15 fish/group), and significance was tested with a Kruskal–Wallis test. Scale bar = 20 µm. **P < 0.01. EXPRESSION / LABELING:
PHENOTYPE:
|


