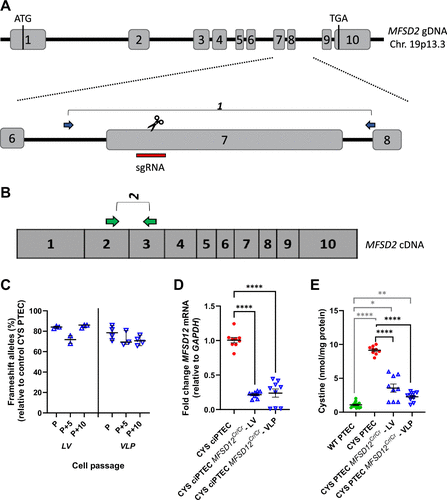
Fig. 2 CYS ciPTEC MFSD12Cr/Cr was generated by CRISPR/Cas9 gene editing in MFSD12 exon 7 and presented reduced cystine levels. A: schematic representation of the genomic locus of MFSD12. Exons are indicated in numbered boxes, with the start and stop codons. Gene editing was performed in the CYS ciPTECs with lentiviral vectors (LVs) and virus-like particles (VLPs) with a sgRNA directed toward exon 7 (red bar). The blue arrows indicate the location of primer pair 1 for sequencing. B: the green arrows show primer pair 2 on the MFSD12 cDNA for Q-RT-PCR. C: the multiclonal line reads from the CYS ciPTEC MFSD12Cr/Cr-LV and -VLP were deconvoluted with DECODR. The % of frameshift alleles is shown for a 10-passage range (passage P, P + 5 and P + 10). Each dot represents a replicate from a total of three experiments. Data were analyzed with Kruskal–Wallis tests and a median with 95% CI is shown. D: MFSD12 mRNA levels were measured in the CYS ciPTEC MFSD12Cr/Cr-LV and -VLP compared with the unedited controls. Each dot represents a replicate from three independent experiments. Data were compared with CYS ciPTEC with one-way ANOVA. ****P < 0.0001. E: CYS ciPTEC MFSD12Cr/Cr cells were collected for cystine analysis after differentiation for 10 days at 37°C. Nine biological replicates, from 3 independent experiments, are represented. Data were compared with the CYS ciPTEC and the wildtype (WT) reference with Welch’s ANOVA and Dunnett’s multiple testing. Means with SE are shown. CYS, cystinosis; ciPTEC, conditionally immortalized proximal tubular epithelial cell. *P < 0.05; **P < 0.01; ****P < 0.0001.
Image
Figure Caption
Acknowledgments
This image is the copyrighted work of the attributed author or publisher, and
ZFIN has permission only to display this image to its users.
Additional permissions should be obtained from the applicable author or publisher of the image.
Full text @ Am. J. Physiol. Renal Physiol.

