FIGURE SUMMARY
Title

Engineered therapeutic antibodies with mannose 6-phosphate analogues as a tool to degrade extracellular proteins

Authors
Daurat, M., Gauthier, C., El Cheikh, K., Ali, L.M.A., Morère, E., Bettache, N., Gary-Bobo, M., Morère, A., Garcia, M., Maynadier, M., Basile, I.
Source
Full text @ Front Immunol

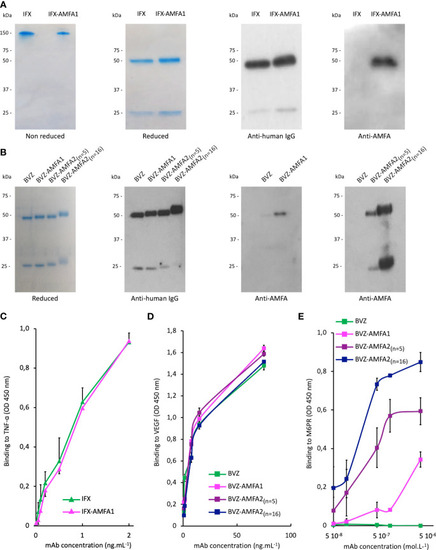
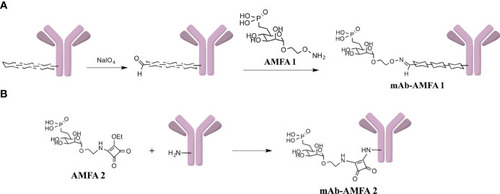
Characterization of Infliximab (IFX) and Bevacizumab (BVZ) before and after AMFA grafting. Analysis of IFX and IFX-AMFA1 (A) and BVZ, BVZ-AMFA1 and BVZ-AMFA2 (B) under non reducing and reducing conditions of SDS-PAGE followed by Coomassie blue staining or by Western blotting using anti-human IgG or anti-AMFA antibodies. Affinity of IFX and IFX-AMFA1 for TNF-α (C), affinity of BVZ, BVZ-AMFA1 and BVZ-AMFA2 for VEGF (D) and the M6PR (E). Binding assays were performed by ELISA method. Results of two independent experiments are presented as mean ± SD of absorbance values at 450 nm.

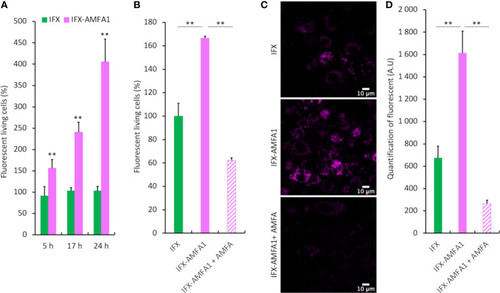
Cellular internalization of mAb and mAb-AMFA in cells and M6PR-dependency. After conjugation with AlexaFluor647® dye, 0.75 µg.mL-1 IFX or IFX-AMFA1 were incubated with Jurkat or macrophage-like cells in the presence of 0.188 µg.mL-1 TNF-α. Internalization of mAb quantified by fluorescence measurement by flow cytometry at different time points (A). Involvement of M6PR in IFX-AMFA1 endocytosis. An AMFA excess was added to saturate M6PR and the fluorescence was studied by flow cytometry in Jurkat cells (B) or by confocal microscopy in macrophage-like cells (C). Quantification of confocal microscopy was performed on an average of 6-7 images consisting each of 100 cells per condition (D). Results are expressed as a percentage ± SD of mAb internalization relatively to IFX (A, B) or as mean of intensity ± SD (D). Student’s T-test: ** p value < 0.01.

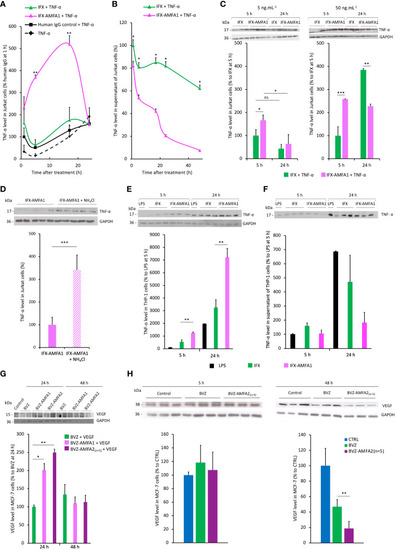
Internalization and degradation of TNF-α and VEGF in cell lines. Internalization in Jurkat cells treated with 20 ng.mL-1 IFX, IFX-AMFA1 or human IgG control in the presence of 5 ng.mL-1 TNF-α at different time points. Antigen levels in the cell lysates (A) or the supernatants (B) were analyzed by Western blotting and quantified using the ImageJ software. Original Western blots are presented in Supplementary Figures S2A and B. Results are expressed as a percentage ± SD of TNF-α internalization relative to human IgG control (A), IFX (B) after 1 h. (A, B). Student’s T test: p value < 0.05 for IFX-AMFA1 5 h vs IFX-AMFA1 24 h. Dose-response experiment performed in Jurkat cells to demonstrate the efficacy of IFX-AMFA1 in degrading TNF-α as a function of antibody concentration (C). Jurkat cells were treated in triplicate with 5 ng.mL-1 TNF-α and 5 ng.mL-1 or 50 ng.mL-1 IFX or IFX-AMFA1 for 5 h or 24 h. Results are expressed as the percentage of TNF-α in cells as a function of the time of treatment ± SD of IFX-AMFA1-treated cells compared to IFX-treated cells 5 h. Lysosomal involvement in the degradation mediated by IFX-AMFA (D). Jurkat cells were treated with 20 ng.mL-1 IFX-AMFA1 and 5 ng.mL-1 TNF-α for 24 h in the presence or absence of the lysosomal inhibitor NH4Cl (10 mM). Antigen levels in the cell lysates (D) or the supernatants (Supplementary Figure S2C) were analyzed by Western blotting and quantified using the ImageJ software. Degradation of TNF-α secreted by stimulated THP-1 cells (E, F). TNF-α internalization was assayed on THP-1 cells stimulated with LPS for 5 h and then treated with 20 ng.mL-1 IFX or IFX-AMFA1 for 5 h or 24 h. Results represent the mean of triplicates of one representative experiment out of three and are expressed as the percentage of TNF-α in cells (E) or in the supernatant (F) of these cells ± SD compared to control cells without mAb treatment (n=3). Degradation of VEGF in MCF-7 cells (G, H). MCF-7 cells were treated with 20 ng.mL-1 BVZ, BVZ-AMFA1 or BVZ-AMFA2(n=5) and 2.5 ng.mL-1 recombinant human VEGF for 24 h or 48 h. VEGF levels in the cell lysates were analyzed by Western blotting. Results represent the mean of duplicates of one representative experiment out of two expressed as a percentage ± SD of VEGF internalization relative to BVZ (G). MCF-7 were maintained in culture medium with 1% FBS for 48 h and produced VEGF, then cells were treated with 20 ng.mL-1 BVZ or BVZ-AMFA2(n=5) for 5 h or 48 h. VEGF levels in the cell lysates were analyzed by Western blotting. Results represent the mean of duplicates of one representative experiment out of two as a percentage ± SD of VEGF internalization relative to CTRL (H). Student’s T-test: ns, not significant, * p value < 0.05; ** p value < 0.01; *** p value < 0.001.

Neutralization of the cellular activities of antigens with mAb-AMFA. Murine fibroblasts L929 were treated with 5 ng.mL-1 TNF-α and increasing doses of IFX or IFX-AMFA1
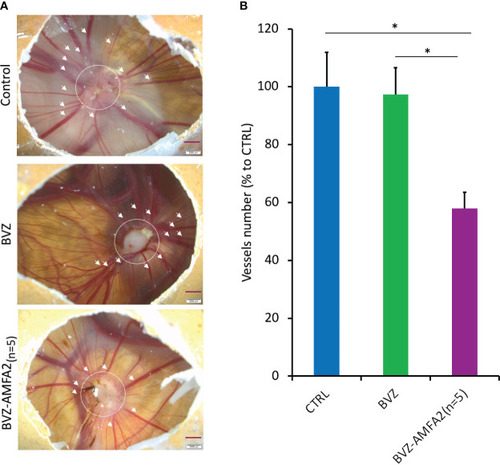
 (A). HUVECs were treated with 50 ng.mL-1 of VEGF and increasing doses of BVZ or BVZ-AMFA1 (B). The neutralization of antigens effect was evaluated by a cell viability assay by incubating cells with MTT. Results are expressed as a percentage ± SD of control cells without mAb treatment. Student’s T-test: * p value < 0.05; ** p value < 0.01.

In vivo efficacy of BVZ-AMFA2(n=5) in zebrafish angiogenesis model. Tg(fli1:eGFP) zebrafish embryos were injected intravenously with 15 ng BVZ or BVZ-AMFA2(n=5) at 48 hours post fertilization. Zebrafish embryos were observed at 0, 24 and 48 h post-injection under confocal microscope. The representative fluorescence images of control (n=8) and embryos treated with BVZ (n=11) or BVZ-AMFA2(n=5) (n=11) at 48 h post-injection are presented for the subintestinal vessels (SIVs) area, and the blood vessels are indicated by arrows (A). The SIVs area (B) and the number of blood vessels (C) were determined, and the results are expressed as the angiogenesis rate compared to the value at T0 or as the number of blood vessels, respectively. Tukey’s test: * p value < 0.05; ** p value < 0.01.

In vivo efficacy of BVZ-AMFA2(n=5) tumor angiogenesis in the CAM of chick embryos. After injection of 106 MDA-MB-231 human cancer cells at day 9 in CAM, embryos were treated with 1 mg.kg-1 BVZ or BVZ-AMFA2(n=5) or vehicle at days 10, 12, 13 and 15. The representative pictures of control and embryos treated with BVZ or BVZ-AMFA2(n=5) at day 16 are presented and the number of blood vessels of size > 130 µm surrounding the tumor area are indicated by the arrows (A). The mean ± SD of vessels counted in 7 embryos treated with BVZ or BVZ-AMFA2(n=5) and in 7 vehicle-treated embryos are presented (B). Tukey’s test: * p value < 0.05.

(A) Functionalization of oligosaccharidic chains of mAb with AMFA1 leading to mAb-AMFA1 (i.e. BVZ-AMFA1 and IFX-AMFA1). (B) Functionalization of ε-amine of lysines of mAb with AMFA2 leading to mAb-AMFA2 (i.e. BVZ-AMFA2).

Acknowledgments
This image is the copyrighted work of the attributed author or publisher, and ZFIN has permission only to display this image to its users. Additional permissions should be obtained from the applicable author or publisher of the image. Full text @ Front Immunol