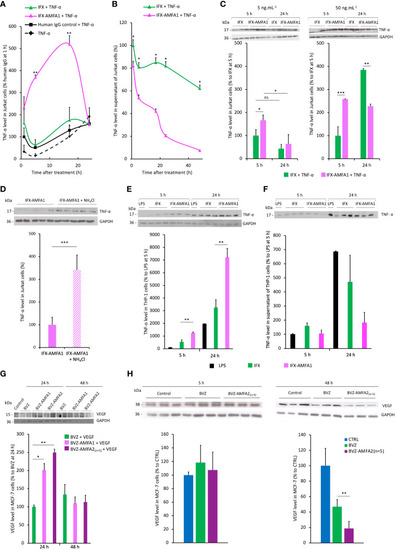
Internalization and degradation of TNF-α and VEGF in cell lines. Internalization in Jurkat cells treated with 20 ng.mL-1 IFX, IFX-AMFA1 or human IgG control in the presence of 5 ng.mL-1 TNF-α at different time points. Antigen levels in the cell lysates (A) or the supernatants (B) were analyzed by Western blotting and quantified using the ImageJ software. Original Western blots are presented in Supplementary Figures S2A and B. Results are expressed as a percentage ± SD of TNF-α internalization relative to human IgG control (A), IFX (B) after 1 h. (A, B). Student’s T test: p value < 0.05 for IFX-AMFA1 5 h vs IFX-AMFA1 24 h. Dose-response experiment performed in Jurkat cells to demonstrate the efficacy of IFX-AMFA1 in degrading TNF-α as a function of antibody concentration (C). Jurkat cells were treated in triplicate with 5 ng.mL-1 TNF-α and 5 ng.mL-1 or 50 ng.mL-1 IFX or IFX-AMFA1 for 5 h or 24 h. Results are expressed as the percentage of TNF-α in cells as a function of the time of treatment ± SD of IFX-AMFA1-treated cells compared to IFX-treated cells 5 h. Lysosomal involvement in the degradation mediated by IFX-AMFA (D). Jurkat cells were treated with 20 ng.mL-1 IFX-AMFA1 and 5 ng.mL-1 TNF-α for 24 h in the presence or absence of the lysosomal inhibitor NH4Cl (10 mM). Antigen levels in the cell lysates (D) or the supernatants (Supplementary Figure S2C) were analyzed by Western blotting and quantified using the ImageJ software. Degradation of TNF-α secreted by stimulated THP-1 cells (E, F). TNF-α internalization was assayed on THP-1 cells stimulated with LPS for 5 h and then treated with 20 ng.mL-1 IFX or IFX-AMFA1 for 5 h or 24 h. Results represent the mean of triplicates of one representative experiment out of three and are expressed as the percentage of TNF-α in cells (E) or in the supernatant (F) of these cells ± SD compared to control cells without mAb treatment (n=3). Degradation of VEGF in MCF-7 cells (G, H). MCF-7 cells were treated with 20 ng.mL-1 BVZ, BVZ-AMFA1 or BVZ-AMFA2(n=5) and 2.5 ng.mL-1 recombinant human VEGF for 24 h or 48 h. VEGF levels in the cell lysates were analyzed by Western blotting. Results represent the mean of duplicates of one representative experiment out of two expressed as a percentage ± SD of VEGF internalization relative to BVZ (G). MCF-7 were maintained in culture medium with 1% FBS for 48 h and produced VEGF, then cells were treated with 20 ng.mL-1 BVZ or BVZ-AMFA2(n=5) for 5 h or 48 h. VEGF levels in the cell lysates were analyzed by Western blotting. Results represent the mean of duplicates of one representative experiment out of two as a percentage ± SD of VEGF internalization relative to CTRL (H). Student’s T-test: ns, not significant, * p value < 0.05; ** p value < 0.01; *** p value < 0.001.
|
