FIGURE SUMMARY
Title

Age-related changes in the zebrafish and killifish inner ear and lateral line

Authors
Coffin, A.B., Dale, E., Molano, O., Pederson, A., Costa, E.K., Chen, J.
Source
Full text @ Sci. Rep.

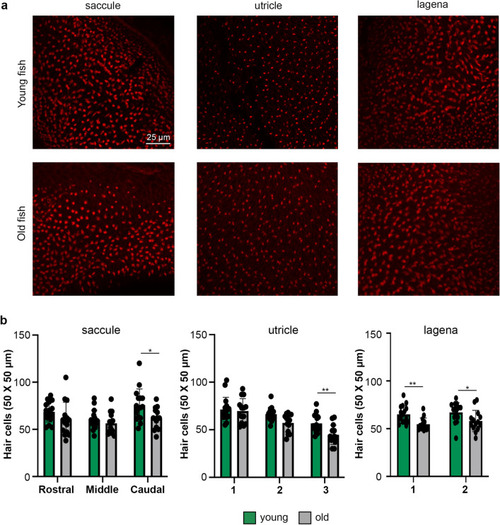
Young zebrafish have more inner ear hair cells. (a) Representative confocal images of inner ear epithelia from young (top row) and old (bottom row) adult zebrafish. The scale bar in the top left image applies to all images. (b) Quantification of phalloidin-labeled hair bundles from young (green bars) and old (gray bars) zebrafish epithelia. Hair bundles were counted in three 50 X 50 µm regions of interest (ROI) per epithelium for the saccule and utricle and two 50 X 50 µm ROI for the lagena. Graphs show hair bundle quantification for each epithelium separated by ROI. There is a significant main effect of age for each epithelium. Saccule, F1,85 = 8.593; p = 0.0043; utricle F1,84 = 11.89, p = 0.0009; lagena F1,56 = 15.68, p = 0.0002. There is no significant age-by-region interaction for any epithelium (saccule, F2,84 = 1.08, p = 0.344; utricle F2,84 = 1.98, p = 0.144; lagena F1,56 = 0.09, p = 0.770). Bonferroni-corrected post-hoc tests, *p < 0.05, **p < 0.01. Data are presented as mean ± 1 s.d. and dots represent individual fish. N = 16 young fish, n = 14 old fish.

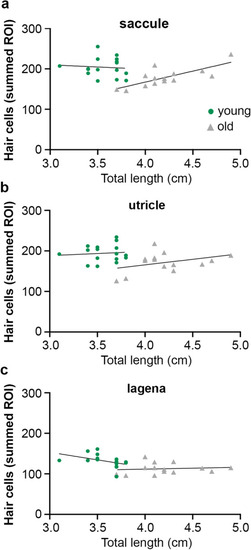
Hair cell density in zebrafish is not tightly correlated with fish length. (ac) Linear regression of total length (TL, measured in cm) by hair bundle density for the summed ROI for the saccule (a), utricle (b), and lagena (c) (see Fig. 1. Legend and Suppl. Figure 1 for ROI details). (a) There is little correlation between TL and hair cell number in the saccule of young fish (green dots; R2 = 0.0073) and the slope of the regression line is not significantly different from zero (F1,14 = 0.1031, p = 0.7529). The correlation is larger in the saccule of old fish (gray triangles) (R2 = 0.5839; slope F1,12 = 16.84, p = 0.0015). (b) There is little correlation between hair cell number and fish length in the utricle for either age class. Young fish: R2 = 0.0088. Slope not significantly different from zero (F1,14 = 0.1254, p = 0.7286). Old fish: R2 = 0.1436. Slope not significantly different from zero (F1,12 = 2.012, p = 0.1815). (c) There is little correlation between hair cell number and fish length in the lagena for either age class. Young fish: R2 = 0.1988. Slope not significantly different from zero (F1,14 = 3.473, p = 0.0835). Old fish: R2 = 0.0131. Slope not significantly different from zero (F1,12 = 0.1592, p = 0.6969). N = 16 young fish, n = 14 old fish.

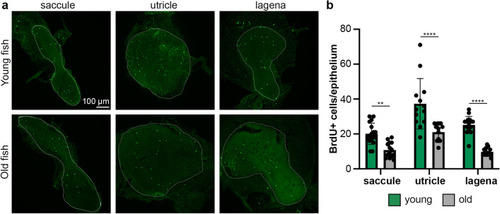
Cell proliferation is higher in the ears of young zebrafish. (a) Representative confocal images of inner ear epithelia from young (top row) and old (bottom row) adult zebrafish. The scale bar in the top left image applies to all images. Epithelia are outlined with white dotted lines. (b) Quantification of BrdU + cells in each epithelium in young (green bars) and old (gray bars) adult zebrafish. There is a significant effect of age on BrdU + cell count (2-way ANOVA, F1,80 = 78.32, p < 0.0001). All Bonferroni-corrected pairwise comparisons are significant **p < 0.01, ****p < 0.0001. Data are presented as mean ± 1 s.d. and dots represent individual fish. N = 14–17 epithelia from young fish, n = 13–14 epithelia from old fish.

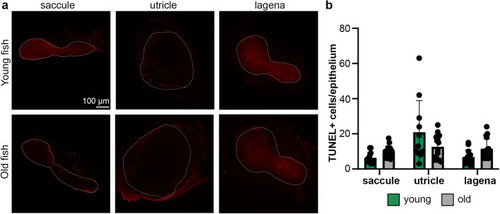
Cell death doesn’t significantly change with age in the zebrafish ear. (a) Representative confocal images of inner ear epithelia from young (top row) and old (bottom row) adult zebrafish. The scale bar in the top left image applies to all images. Epithelia are outlined with white dotted lines. (b) Quantification of TUNEL + cells in each epithelium in young (green bars) and old (gray bars) adult zebrafish. There was not a significant effect of age on the number of TUNEL + cells (two-way ANOVA, F1,175 = 0.003, p = 0.96). Data are presented as mean ± 1 s.d. and dots represent individual fish. N = 11–13 epithelia from young fish, n = 14–16 epithelia from old fish.

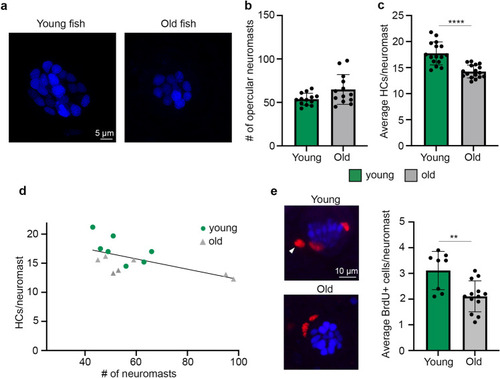
Young zebrafish have more hair cells and more dividing cells per lateral line neuromast. (a) Representative confocal images of opercular neuromasts from a young (left) and old (right) zebrafish. Hair cell nuclei were live-labeled with DAPI. Scale bar applies to both images. (b, c) Comparisons of superficial neuromast number (b) and hair cell number (c) on zebrafish opercula between young (green bars) and old (gray bars) fish. (b) There is no age difference in the number of superficial opercular neuromasts (Mann Whitney U test, p = 0.088). N = 13 fish/age class. (c) Young fish have significantly more hair cells per neuromast (2-tailed t-test, p < 0.0001). N = 16–17 fish/age class. (d) There is a negative relationship between neuromast number and hair cells/neuromast (R2 = 0.3716; n = 7 fish/age class). (e) Young fish have significantly more BrdU + cells per opercular neuromast (2-tailed t-test, p = 0.0069). N = 8–13 fish/age class. Confocal images on the left in panel (e) show DAPI + hair cell nuclei in blue and BrdU + cells in red. White arrowhead points to an example BrdU + cell and the scale bar applies to both images. Data represent the average of 10 neuromasts per fish for each dataset. **p < 0.01, ****p < 0.0001. Data are presented as mean ± 1 s.d. and dots represent individual fish.

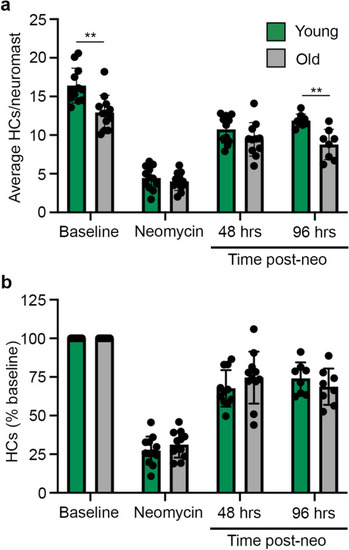
Lateral line regeneration does not change with age in zebrafish. (a) There is a significant effect of age when data are analyzed using the average number of hair cells (HCs) per caudal neuromast (mixed-effects model, F1,22 = 12.93, p = 0.0016 for the fixed effect of fish age), with significantly fewer hair cells in old fish at baseline and again 96 h after neomycin damage (Bonferroni-corrected posthoc t-test, **p < 0.01). (b) There is no age effect when data are normalized to the number of baseline hair cells for each fish (mixed-effects model, F1,22 = 0.2979, p = 0.5907 for the fixed effect of fish age). N = 8–12 fish/treatment, data are presented as mean ± 1 s.d. and dots represent individual fish. Note the lack of error bars for baseline values in b; each fish was set to 100%.

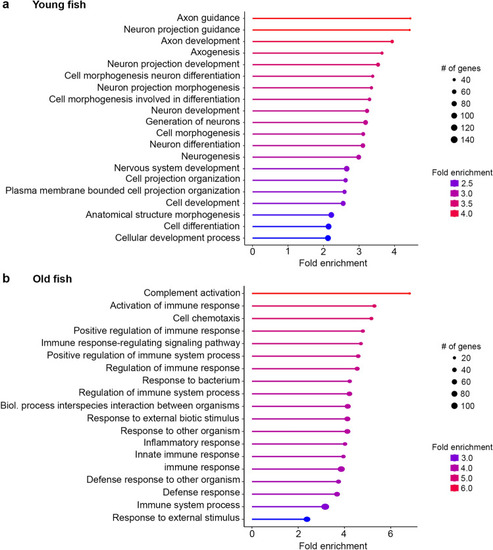
Age-dependent differences in gene expression profiles. GO term analysis for biological process from bulk RNA-Seq data in (a) young zebrafish and (b) old zebrafish. Ears from young fish show enrichment of genes for neural development, while genes for inflammation and immune function are upregulated in ears from old fish. Circle size represents the number of genes contained within a given GO term, while colors represent fold enrichment. Note that the circle size and color scale differ between panels (a) and (b).

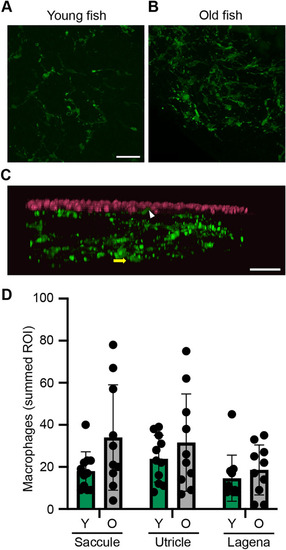
Older fish have more inner ear macrophages. (a, b) Representative confocal images (maximum z projection) of saccules from (a) young and (b) old zebrafish, showing YFP + macrophages in green. Scale bar in a applies to both images. (c) xy projection of the image from b, showing YFP + macrophages in green and phalloidin-labeled hair bundles in magenta. The white arrowhead points to an example of a macrophage in the epithelial layer and the yellow arrow shows a macrophage in the stromal layer, where the majority of macrophages were observed. (d) Quantification of YFP + macrophages from young (Y) (green bars) and old (O) (gray bars) zebrafish epithelia. Macrophages were counted in three 150 X 150 µm ROI per epithelium for the saccule and utricle and two 150 X 150 µm ROI for the lagena. The data show the sum of all ROI for a given epithelium. There is a significant effect of age on macrophage number (2-way ANOVA, F1,57 = 5.064, p = 0.028), although there are not pairwise differences within an epithelium (Bonferroni-corrected posthoc testing). Data are presented as mean ± 1 s.d. N = 10–11 fish per group.

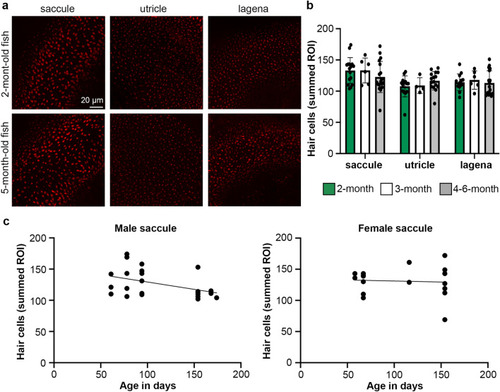
Age and sex effects in killifish inner ear hair cells. (a) Representative confocal images of inner ear epithelia from a 2-month-old (top row) and a 5-month-old (bottom row) adult killifish. The scale bar in the top left image applies to all images. (b) Quantification of phalloidin-labeled hair bundles from 2-month-old (green bars), 3-month-old (white bars) and 4–6-month-old (gray bars) killifish epithelia. Hair bundles were counted in three 50 X 50 µm ROI per epithelium for the saccule and two 50 X 50 µm ROI for the utricle and lagena. The data show the sum of all ROI for a given epithelium. There is no significant effect of age on hair bundle density (2-way ANOVA, main effect of age F2,101 = 0.112, p = 0.894). Data are presented as mean ± 1 s.d. and dots represent individual fish. (c) Linear regression of saccular hair cells by age for male (left) and female (right) killifish. The slope is significantly different from zero for males (F1,21 = 4.78, p = 0.0402) but not females (F1,15 = 0.06, p = 0.8166). N = 7–8 2-month old females, n = 7–8 2-month old males, n = 4–6 3-month-old males, n = 9 4–6-month-old females, n = 7–9 4–6-month-old males.

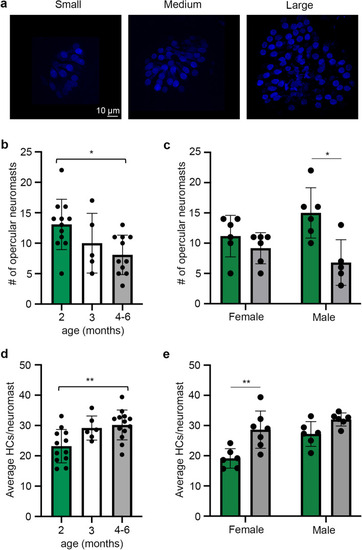
Neuromast number and size varies with killifish age. (a) Representative images of DAPI-labeled superficial neuromasts from killifish opercula. Images show variation in neuromast size, rather than neuromasts from fish of different ages, to demonstrate the size variability seen in all age classes. Scale bar in the left image applies to all images. (b) Quantification of superficial neuromasts on the opercula of 2-, 3-, and 4–6-month-old killifish, data combined from both sexes. There is a significant age-dependent decrease in neuromast number (one-way ANOVA, F2,45 = 4.651, p = 0.019). (c) Neuromast quantification separated by sex. There is a significant decrease in neuromast number in 4–6-month-old male killifish (p = 0.017) but not female killifish (p = 0.249) (Mann–Whitney U tests). (d) Quantification of the number of hair cells (HCs) per superficial neuromast (sexes combined). We quantified hair cells in up to 10 opercular neuromasts per fish (or all visible neuromasts, for fish with fewer than 10), then calculated the average hair cell number for each fish. There was an age-dependent increase in hair cell number per neuromast (one-way ANOVA, F2,28 = 6.674, p = 0.043). Tukey’s multiple comparison posthoc tests show a significant difference between the 2- and 4–6-month-old age classes. (e) HC counts per neuromast separated by sex. There is a significant increase in average HC numbers in old females as compared to young females (p = 0.008) but no age difference in males (p = 0.065) (Mann–Whitney U tests). N = 12–13 fish per group for 2 and 4–6-month-old groups, even split between males and females. N = 5–6 for the 3-month-old group, with only male animals represented. *p < 0.05, **p < 0.01.

Acknowledgments
This image is the copyrighted work of the attributed author or publisher, and ZFIN has permission only to display this image to its users. Additional permissions should be obtained from the applicable author or publisher of the image. Full text @ Sci. Rep.