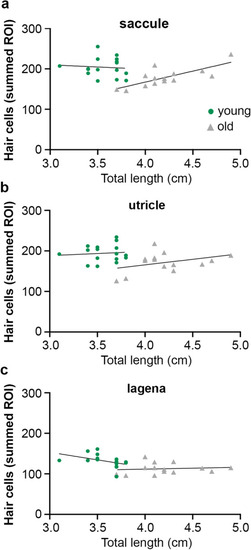
Hair cell density in zebrafish is not tightly correlated with fish length. (a–c) Linear regression of total length (TL, measured in cm) by hair bundle density for the summed ROI for the saccule (a), utricle (b), and lagena (c) (see Fig. 1. Legend and Suppl. Figure 1 for ROI details). (a) There is little correlation between TL and hair cell number in the saccule of young fish (green dots; R2 = 0.0073) and the slope of the regression line is not significantly different from zero (F1,14 = 0.1031, p = 0.7529). The correlation is larger in the saccule of old fish (gray triangles) (R2 = 0.5839; slope F1,12 = 16.84, p = 0.0015). (b) There is little correlation between hair cell number and fish length in the utricle for either age class. Young fish: R2 = 0.0088. Slope not significantly different from zero (F1,14 = 0.1254, p = 0.7286). Old fish: R2 = 0.1436. Slope not significantly different from zero (F1,12 = 2.012, p = 0.1815). (c) There is little correlation between hair cell number and fish length in the lagena for either age class. Young fish: R2 = 0.1988. Slope not significantly different from zero (F1,14 = 3.473, p = 0.0835). Old fish: R2 = 0.0131. Slope not significantly different from zero (F1,12 = 0.1592, p = 0.6969). N = 16 young fish, n = 14 old fish.
|
