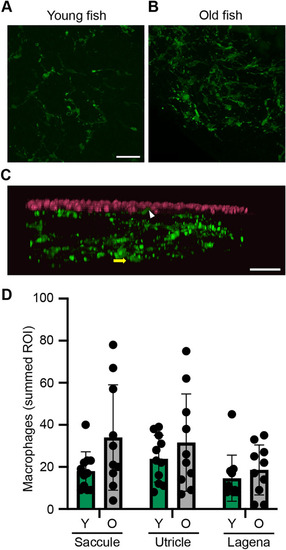
Older fish have more inner ear macrophages. (a, b) Representative confocal images (maximum z projection) of saccules from (a) young and (b) old zebrafish, showing YFP + macrophages in green. Scale bar in a applies to both images. (c) xy projection of the image from b, showing YFP + macrophages in green and phalloidin-labeled hair bundles in magenta. The white arrowhead points to an example of a macrophage in the epithelial layer and the yellow arrow shows a macrophage in the stromal layer, where the majority of macrophages were observed. (d) Quantification of YFP + macrophages from young (Y) (green bars) and old (O) (gray bars) zebrafish epithelia. Macrophages were counted in three 150 X 150 µm ROI per epithelium for the saccule and utricle and two 150 X 150 µm ROI for the lagena. The data show the sum of all ROI for a given epithelium. There is a significant effect of age on macrophage number (2-way ANOVA, F1,57 = 5.064, p = 0.028), although there are not pairwise differences within an epithelium (Bonferroni-corrected posthoc testing). Data are presented as mean ± 1 s.d. N = 10–11 fish per group.
|

