
Image
|
Figure Caption
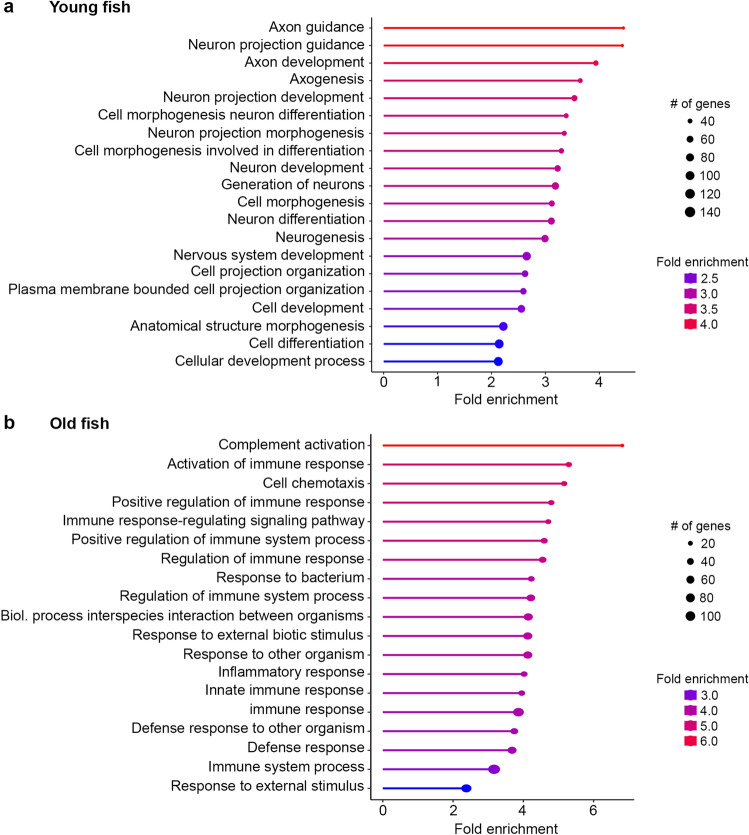
Figure 7
Age-dependent differences in gene expression profiles. GO term analysis for biological process from bulk RNA-Seq data in (
Acknowledgments
This image is the copyrighted work of the attributed author or publisher, and
ZFIN has permission only to display this image to its users.
Additional permissions should be obtained from the applicable author or publisher of the image.
Full text @ Sci. Rep.