
- Title
-
Metabolome evidence of CKDu risks after chronic exposure to simulated Sri Lanka drinking water in zebrafish
- Authors
- Jia, P.P., Li, Y., Zhang, L.C., Wu, M.F., Li, T.Y., Pei, D.S.
- Source
- Full text @ Ecotoxicol. Environ. Saf.
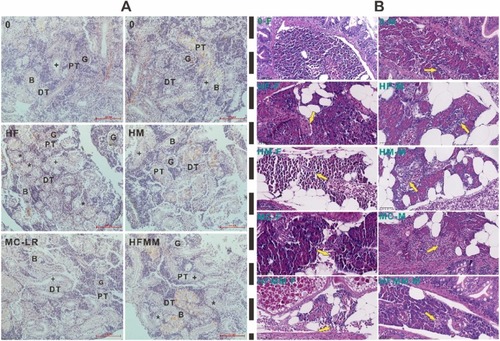
Histopathological analysis of dissected kidney and pancreas tissue of adult zebrafish after chronic exposure to environmental factors. (A) The histopathological analysis of isolated adult zebrafish kidneys (mesonephros) indicated mesonephric nephrons with normal blood filter or glomerulus, proximal tubule, distal tubule, tubular lumen, and brush borders with scale bar 100 μm. The tubule damages with brush borders (*) in the HF and HFMM groups. G: glomerulus; N: neck; PT: proximal tubule: DT: distal tubule; B: brush borders; tubular lumen (+). (B) The histopathological analysis of pancreas tissues with the H&E stains for the female zebrafish in each group, and the damages with inflammatory cell infiltration (yellow arrow) in the exposure groups. |
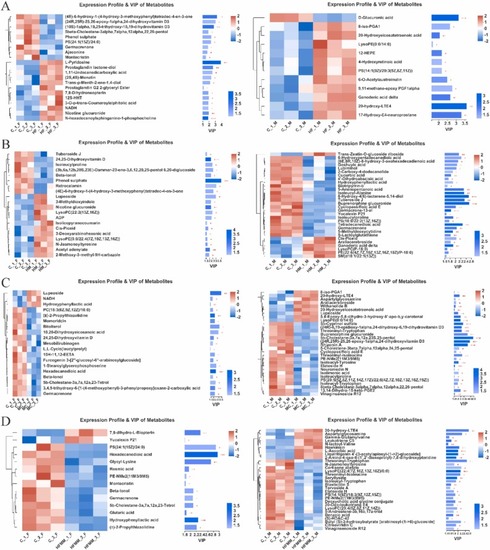
The metabolic disruptions in zebrafish after chronic exposure to environmental factors. (A) The expression profiles & variable importance in projection (VIP) of metabolites in the HF-exposed zebrafish were significantly disrupted compared to the control, and included a total of 21 pos and neg in females and 12 pos and neg in males. (B) The expression profiles & VIP of metabolites in the HM-exposed zebrafish were significantly disrupted compared to the control, and included a total of 20 pos and neg in females and 30 pos and neg in males. (C) The expression profiles & VIP of metabolites in MC-LR exposed zebrafish were significantly disrupted, compared to control, and included a total of 19 pos and neg in females and 30 pos and neg in males. (D) The expression profiles & VIP of metabolites in the HFMM-exposed zebrafish were significantly disrupted compared to the control, and included a total of 14 pos and neg in females and 30 pos and neg in males. The heatmap with red and green boxes indicated the abundance ratio, and the top 30 metabolites were presented with VIP-value >1 and p-value <0.05 and based on the PLS-DA model. |
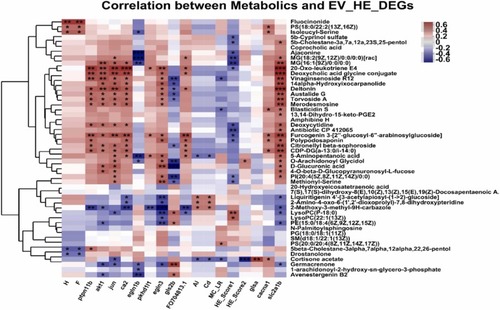
The correlation analysis of different metabolites and environmental factors, H&E scores, and DEGs in exposed zebrafish. The differently changed metabolites showed their correlation to environmental factors, H&E scores, and screened DEGs from exposed zebrafish transcriptomic profiles. The symbols *, **, and *** presented p<0.05, 0.01, and 0.001 with significant differences between different metabolites and analyzed objects. The red and blue color and values indicated their correlation coefficients. |
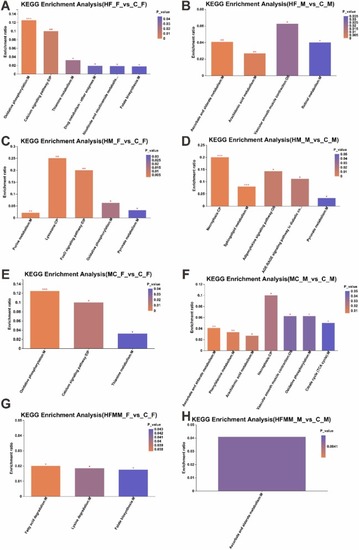
The KEGG enrichment analysis of zebrafish metabolome after exposure. The enriched KEGG pathways of the HF (A, B), HM (C, D), MC (E, F), and HFMM (G, H) in exposed female and male zebrafish metabolomics profiles. The symbols *, **, and *** presented p<0.05, 0.01, and 0.001 with significant differences between exposure and control groups. |
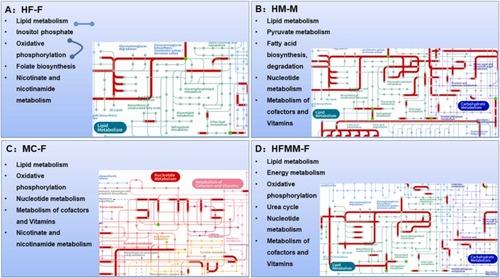
The comprehensive analysis of zebrafish metabolome and transcriptome using the iPath 3.0 (http://pathways.embl.de). (A) The Ipath integrated pathways map of the HF-exposed female zebrafish transcriptome and metabolome. (B) The Ipath integrated pathways map of the HM exposed male zebrafish transcriptome and metabolome. (C) The Ipath integrated pathways map of MC-LR exposed female zebrafish transcriptome and metabolome. (D) The Ipath integrated pathways map of the HFMM-exposed female zebrafish transcriptome and metabolome. The green points stand for the significantly regulated metabolites, and the red lines stand for the DEGs involved in signaling pathways. |
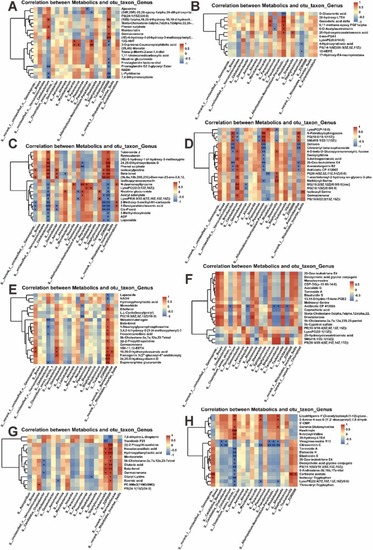
The correlation between significantly changed metabolome and major genera of gut microbiota in exposed zebrafish. The correlation of the HF (A, B), HM (C, D), MC (E, F), and HFMM (G, H) in exposed female and male zebrafish was calculated by the Pearson analysis with top 20 significantly changed metabolome and top 20 major genera. The symbols *, **, and *** presented p<0.05, 0.01, and 0.001 with significant differences between exposure and control groups. |
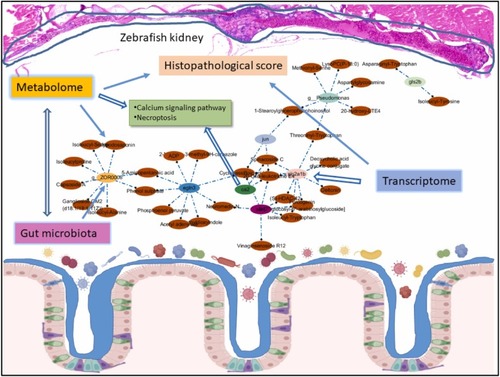
The potential mechanisms of environmental factor-induced CKDu risks based on zebrafish omics changes. Based on the correlation analyses of metabolites and environmental factors, H&E score, DEGs, and gut bacteria at phylum and genus level, the network for multiple relationships was detected and screened with Spearman analysis of the total different metabolites set. Then, the images of the network were constructed by using the String website and Cytoscape (Version 3.10.0). The omics analyses discovered that the gut bacteria of g_ZOR0006, g_Pseudomonas, and DEGs of egln3, ca2, jun, slc2a1b, gls2b, etc, were markedly closely related to metabolites of 20-hydroxy-LTE4, PS(18:0/22:2(13Z,16Z)), neuromedin N, 20-Oxo-leukotriene E4, and phenol sulfate, etc, in exposed zebrafish, and the shared significantly enriched calcium signaling pathways and necroptosis. The correlation coefficient was ≥ 0.6 and ≤−0.6, and the p-value was <0.05 between the control and exposure groups. |